**
Week 1
** Introduction In this post, In this post, we start by designing the logical architecture of our SOC (Security Operations Center) environment. A clear diagram helps us see the components and how they interact, keeping us on track as we build our SOC Lab.
1️: Understand the Components

Before starting the diagram, it’s important to understand the key components that will form our SOC environment:
- SOC Analyst Laptop 🖥️: This is where we’ll interact with Elastic/Kibana through a web GUI to monitor and analyze logs.
- Elastic & Kibana Server 📊: The heart of our monitoring setup, where we’ll collect, store, and visualize log data.
- Fleet Server 🚀: Manages agents deployed across different endpoints to forward logs to Elastic/Kibana.
- Windows and Ubuntu Servers 💻: These are the endpoints that will be managed by the Fleet Server. One server will have RDP enabled, and the other will have SSH enabled.
- osTicket Server 🎟️: An integrated ticketing system that will be connected to Elastic/Kibana for handling alerts and incidents.
- C2 Server (Mythic) 🛠️: The command-and-control server used for simulating attacks and generating telemetry.
Attack Laptop (Kali Linux) 💥: The attacker’s machine used to execute attacks against the SOC environment.
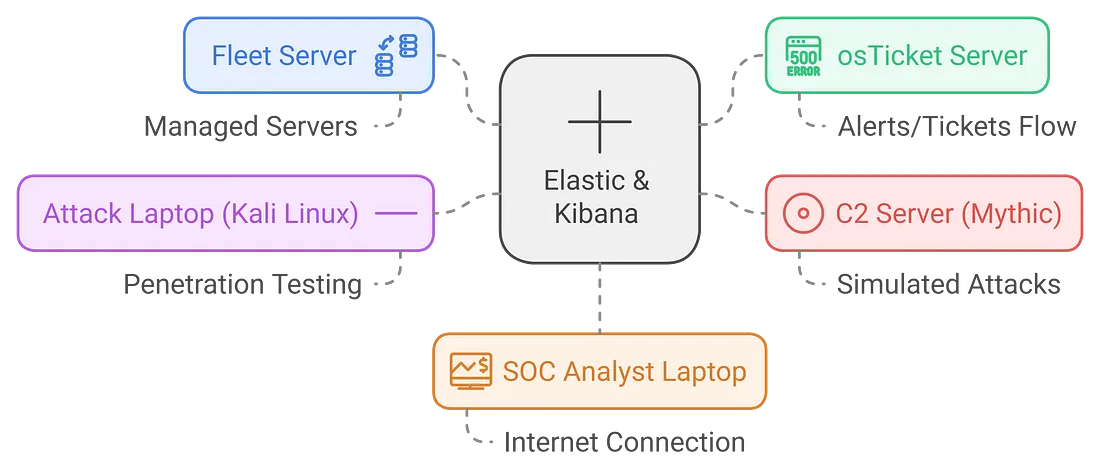
Step 2: Sketch the Diagram
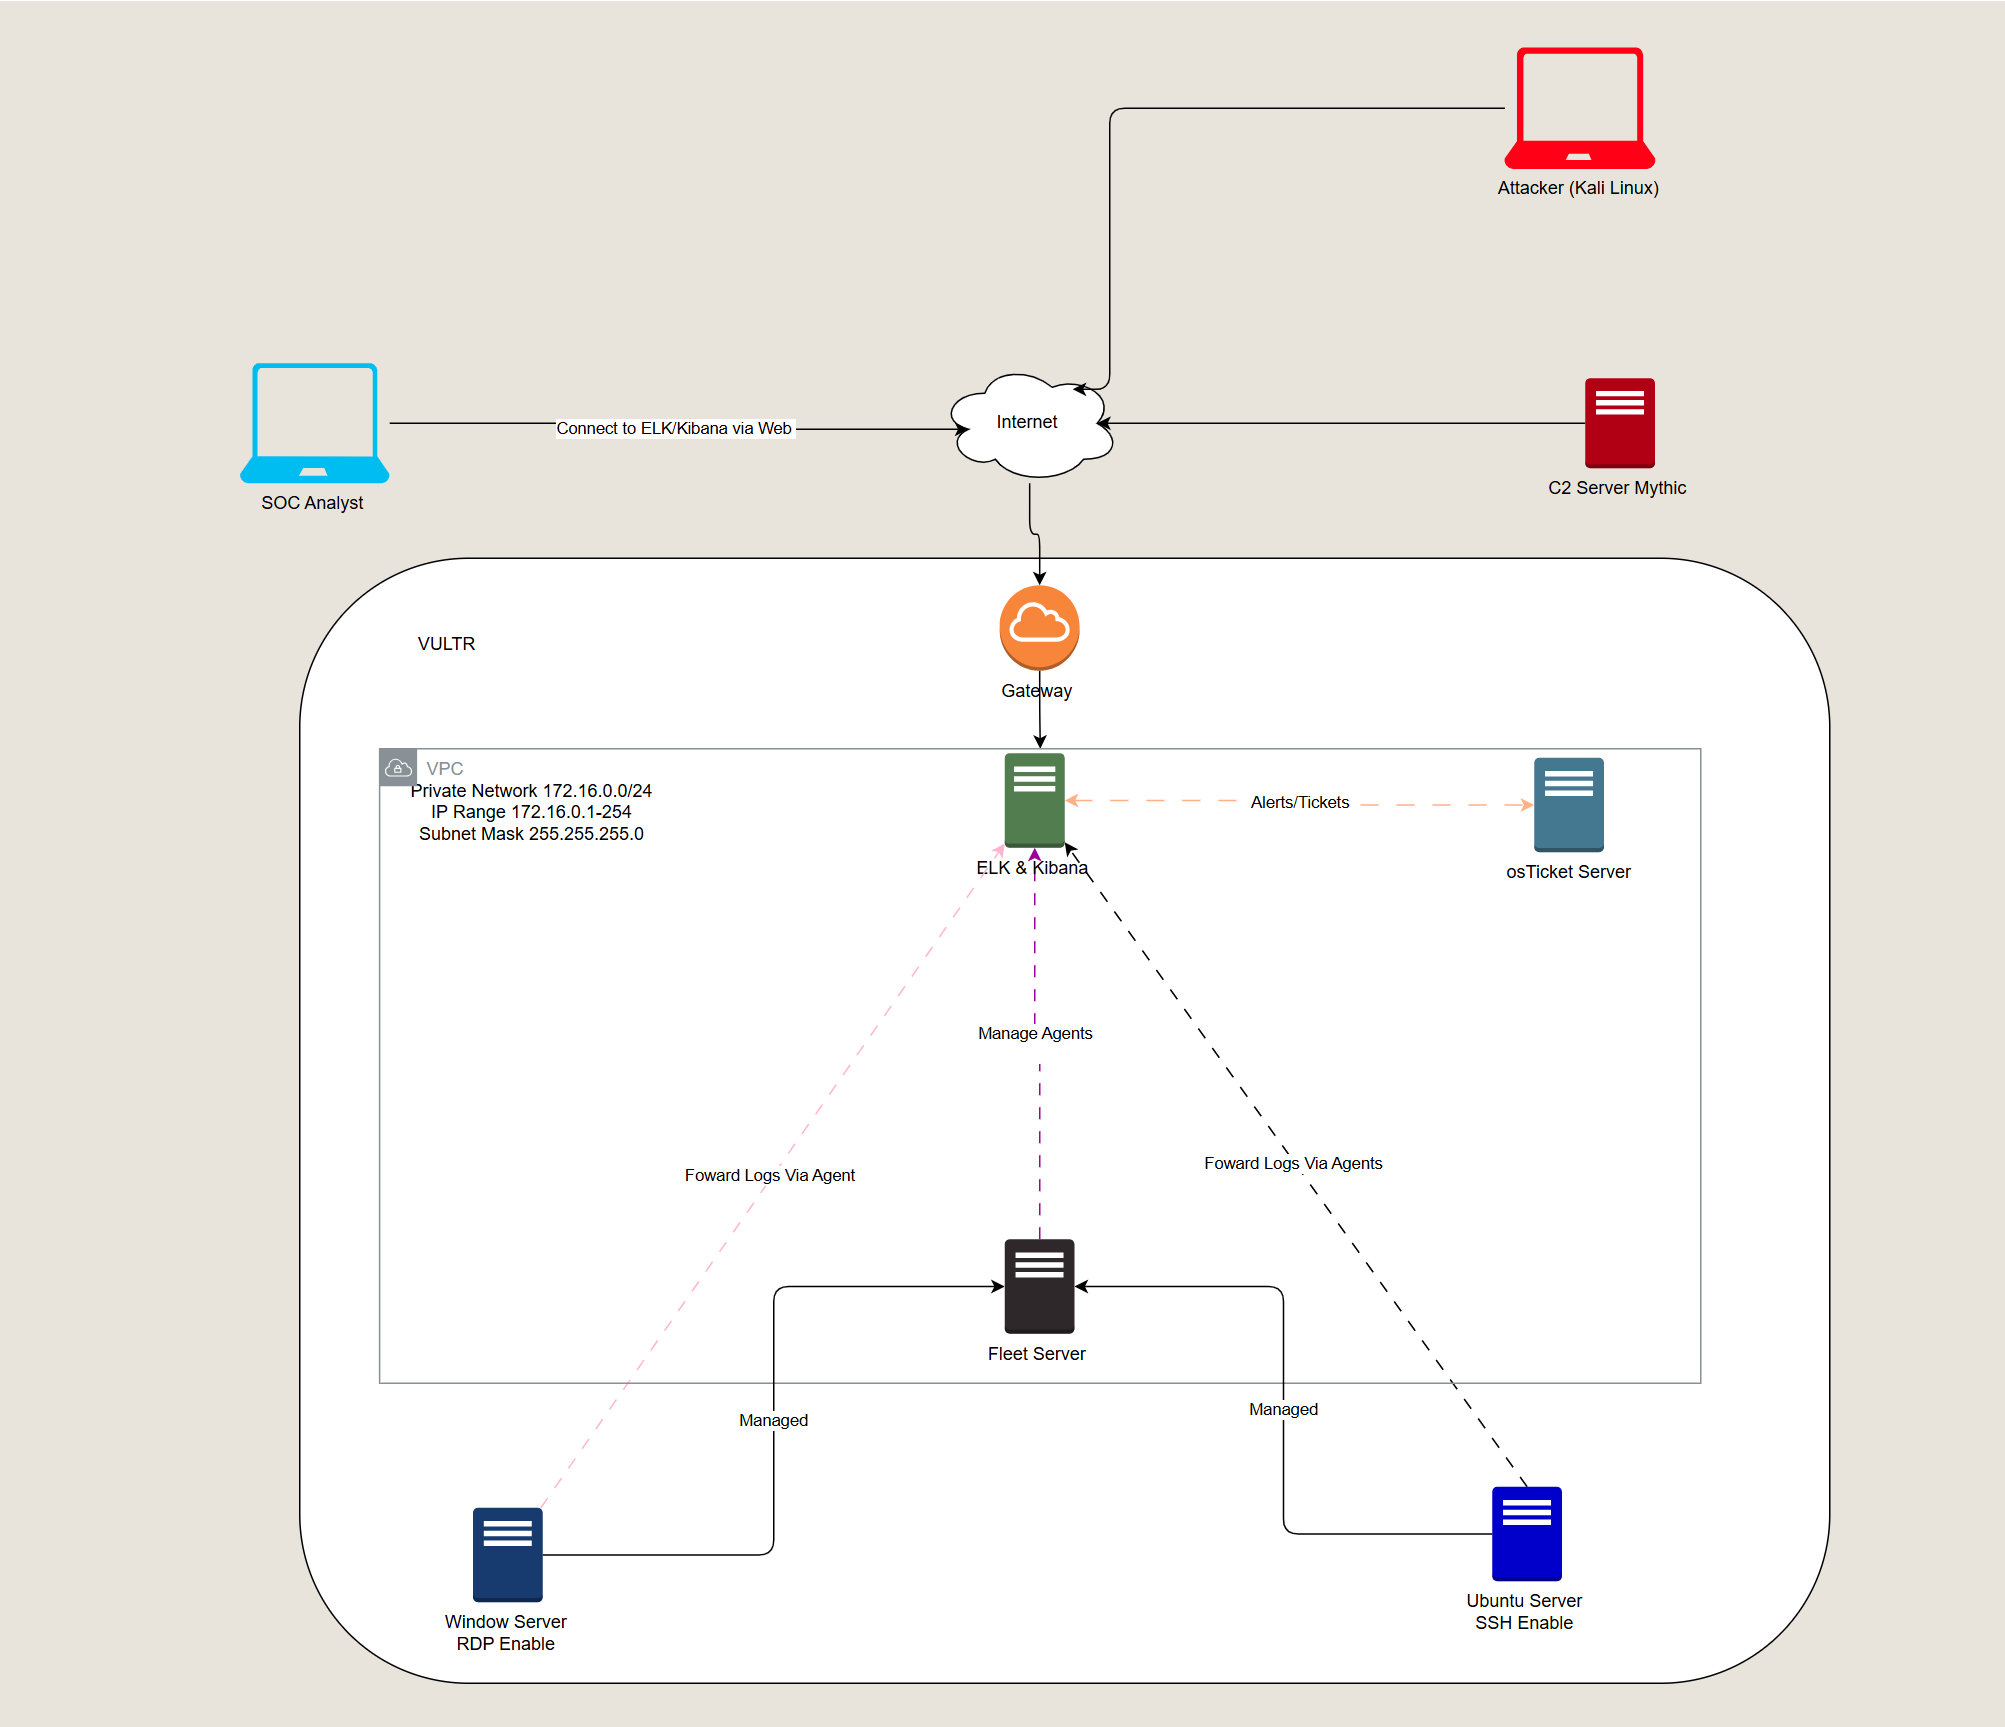
Now that we understand the components, let’s move on to sketch the logical diagram. This diagram shows how each component interacts within the SOC environment.
Step 3: Tools Used
For creating the diagram, draw.io, a free and easy-to-use online diagramming tool.
Step 4: Final Diagram
Here’s the final logical diagram
 What is the ELK Stack? 🤔
The ELK Stack is a combination of three open-source products:
- Elasticsearch - Logstash - Kibana.
Together, they provide a robust platform for searching, analyzing, and visualizing log data in real-time.
Overview of ELK Stack

Components of the ELK Stack
- Elasticsearch (The “E” in ELK) - Logstash (The “L” in ELK) Kibana (The “K” in ELK)
Key Features:
Uses the Elasticsearch Query Language (ESQL). Supports RESTful APIs and JSON for programmable access. Easy to search and retrieve data via a web console using Kibana.
Logstash 🛠️ Logstash is the workhorse of the ELK Stack, responsible for collecting, transforming, and forwarding log data to Elasticsearch.
What It Does:
- Collects telemetry from various sources. - Transforms and filters data before pushing it to Elasticsearch. - Supports multiple ways to collect data, including Beats and Elastic Agents.
Popular Beats:
- Filebeat: For logs
- Metricbeat: For metrics
- Packetbeat: For network data
- Winlogbeat: For Windows Event Logs
- Auditbeat: For audit data
- Heartbeat: For uptime monitoring
Kibana 🎨
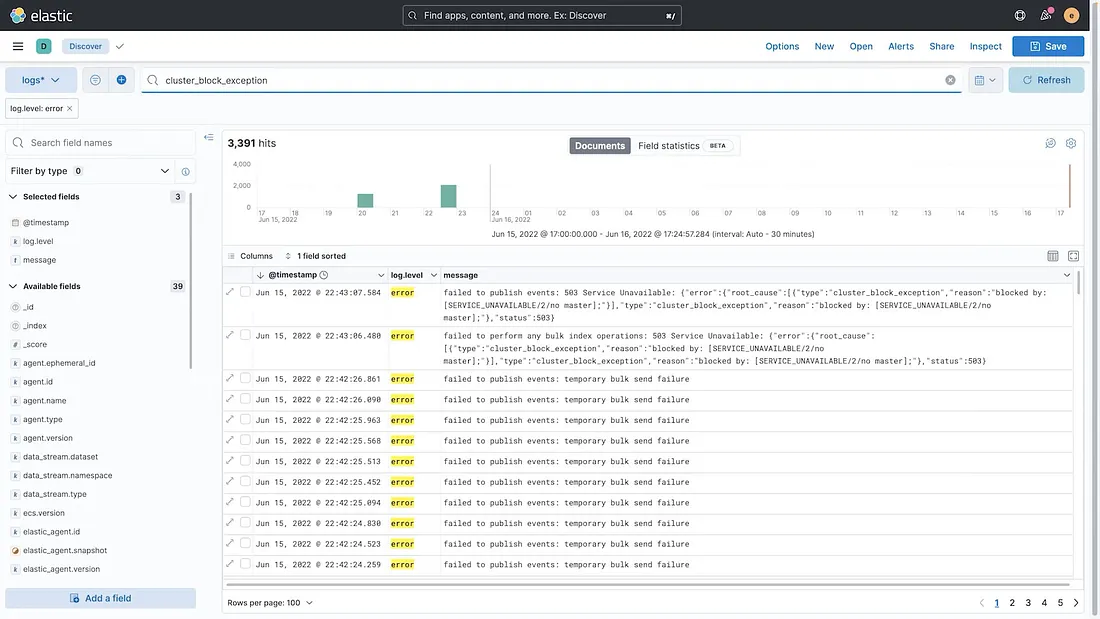
Kibana is the visual interface of the ELK Stack, allowing you to interact with your data through a web console.
Features:
- Visualizations: Drag and drop elements to build dashboards.
- Discover Tab: Query logs using ESQL.
- Machine Learning: For anomaly detection.
- Elastic Maps: For geospatial data.
- Alerting: Create alerts based on specific log data.
Kibana Dashboard
Benefits of the ELK Stack 🌟 Why should you consider using the ELK Stack in your environment? Here are five compelling reasons:
- Centralized Logging: Helps meet compliance requirements and aids in incident response.
- Flexibility in Log Ingestion: Use Beats or Elastic Agents to control what logs are ingested.
- Visualizations: Create dashboards that provide critical information at a glance.
- Scalability: Easily scale the infrastructure to accommodate larger environments.
Ecosystem & Integrations: A wide range of integrations available, with community support for custom needs.
2 Setting Up our Vultr Account 🔁 Step 1: Sign Up on Vultr First things first, head over to Vultr and sign up for an account if you haven’t already. Vultr is offering a $300 credit, which will cover all our cloud needs for this lab. 
Step 2: Accessing VPC Settings
Once you’re logged in, go to the Products section on the left side. Scroll down and select Network, then click on VPC 2.0. This is where you’ll set up your Virtual Private Cloud (VPC) network, which will be the foundation for our Elasticsearch deployment.
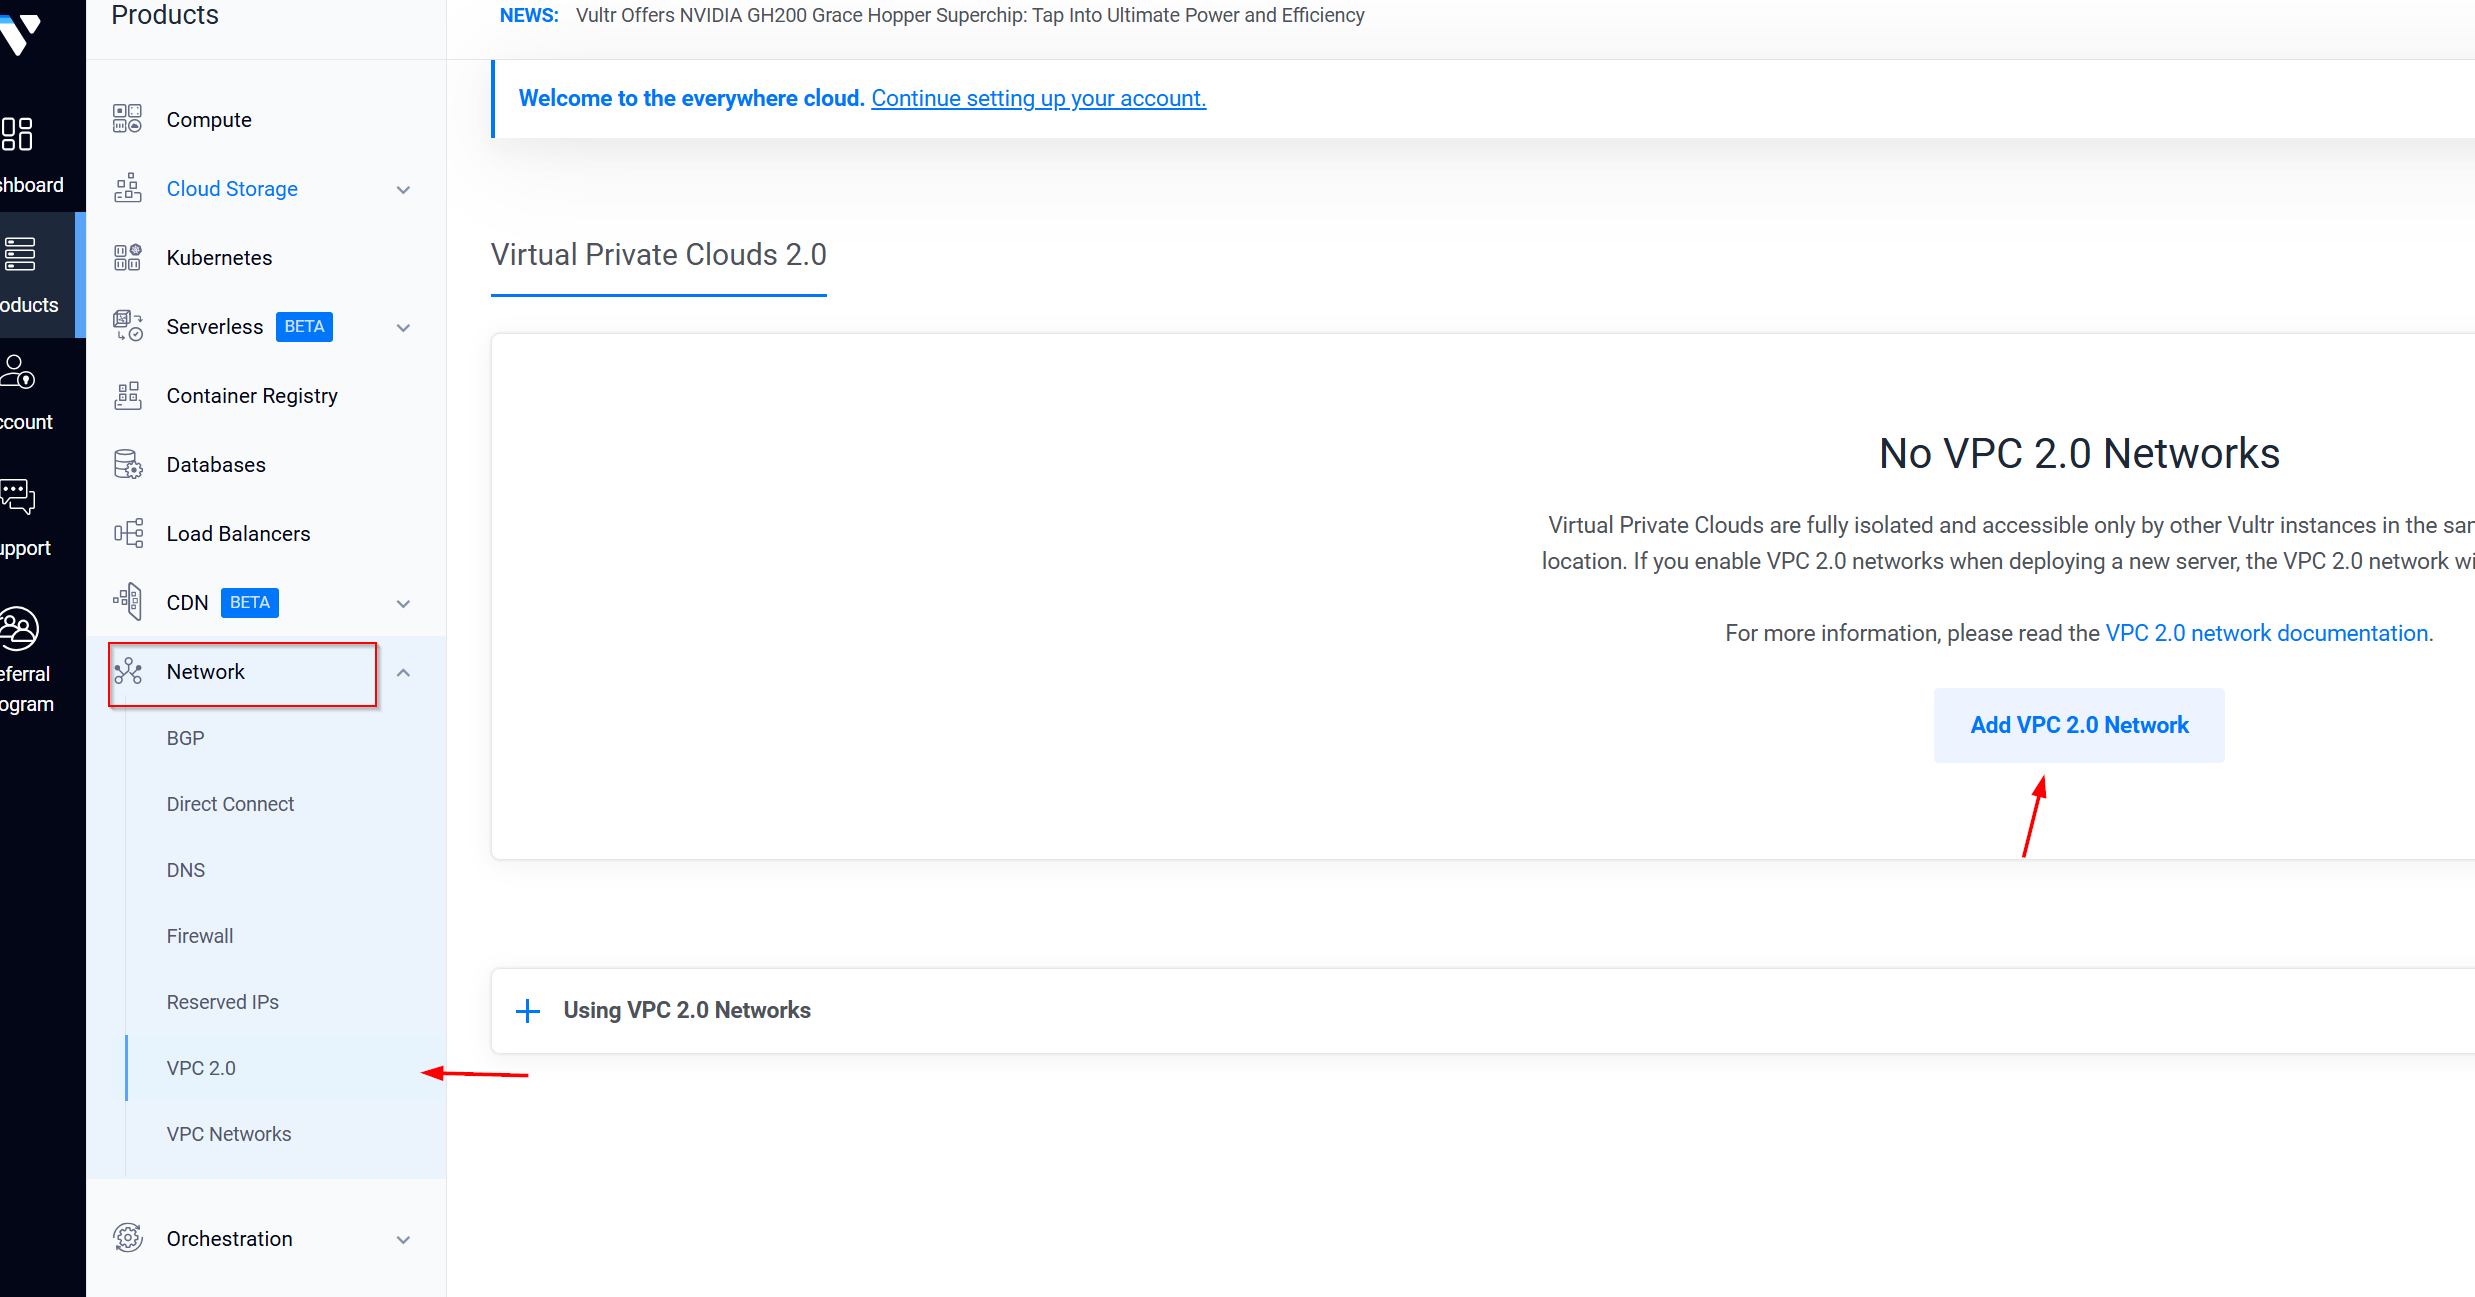
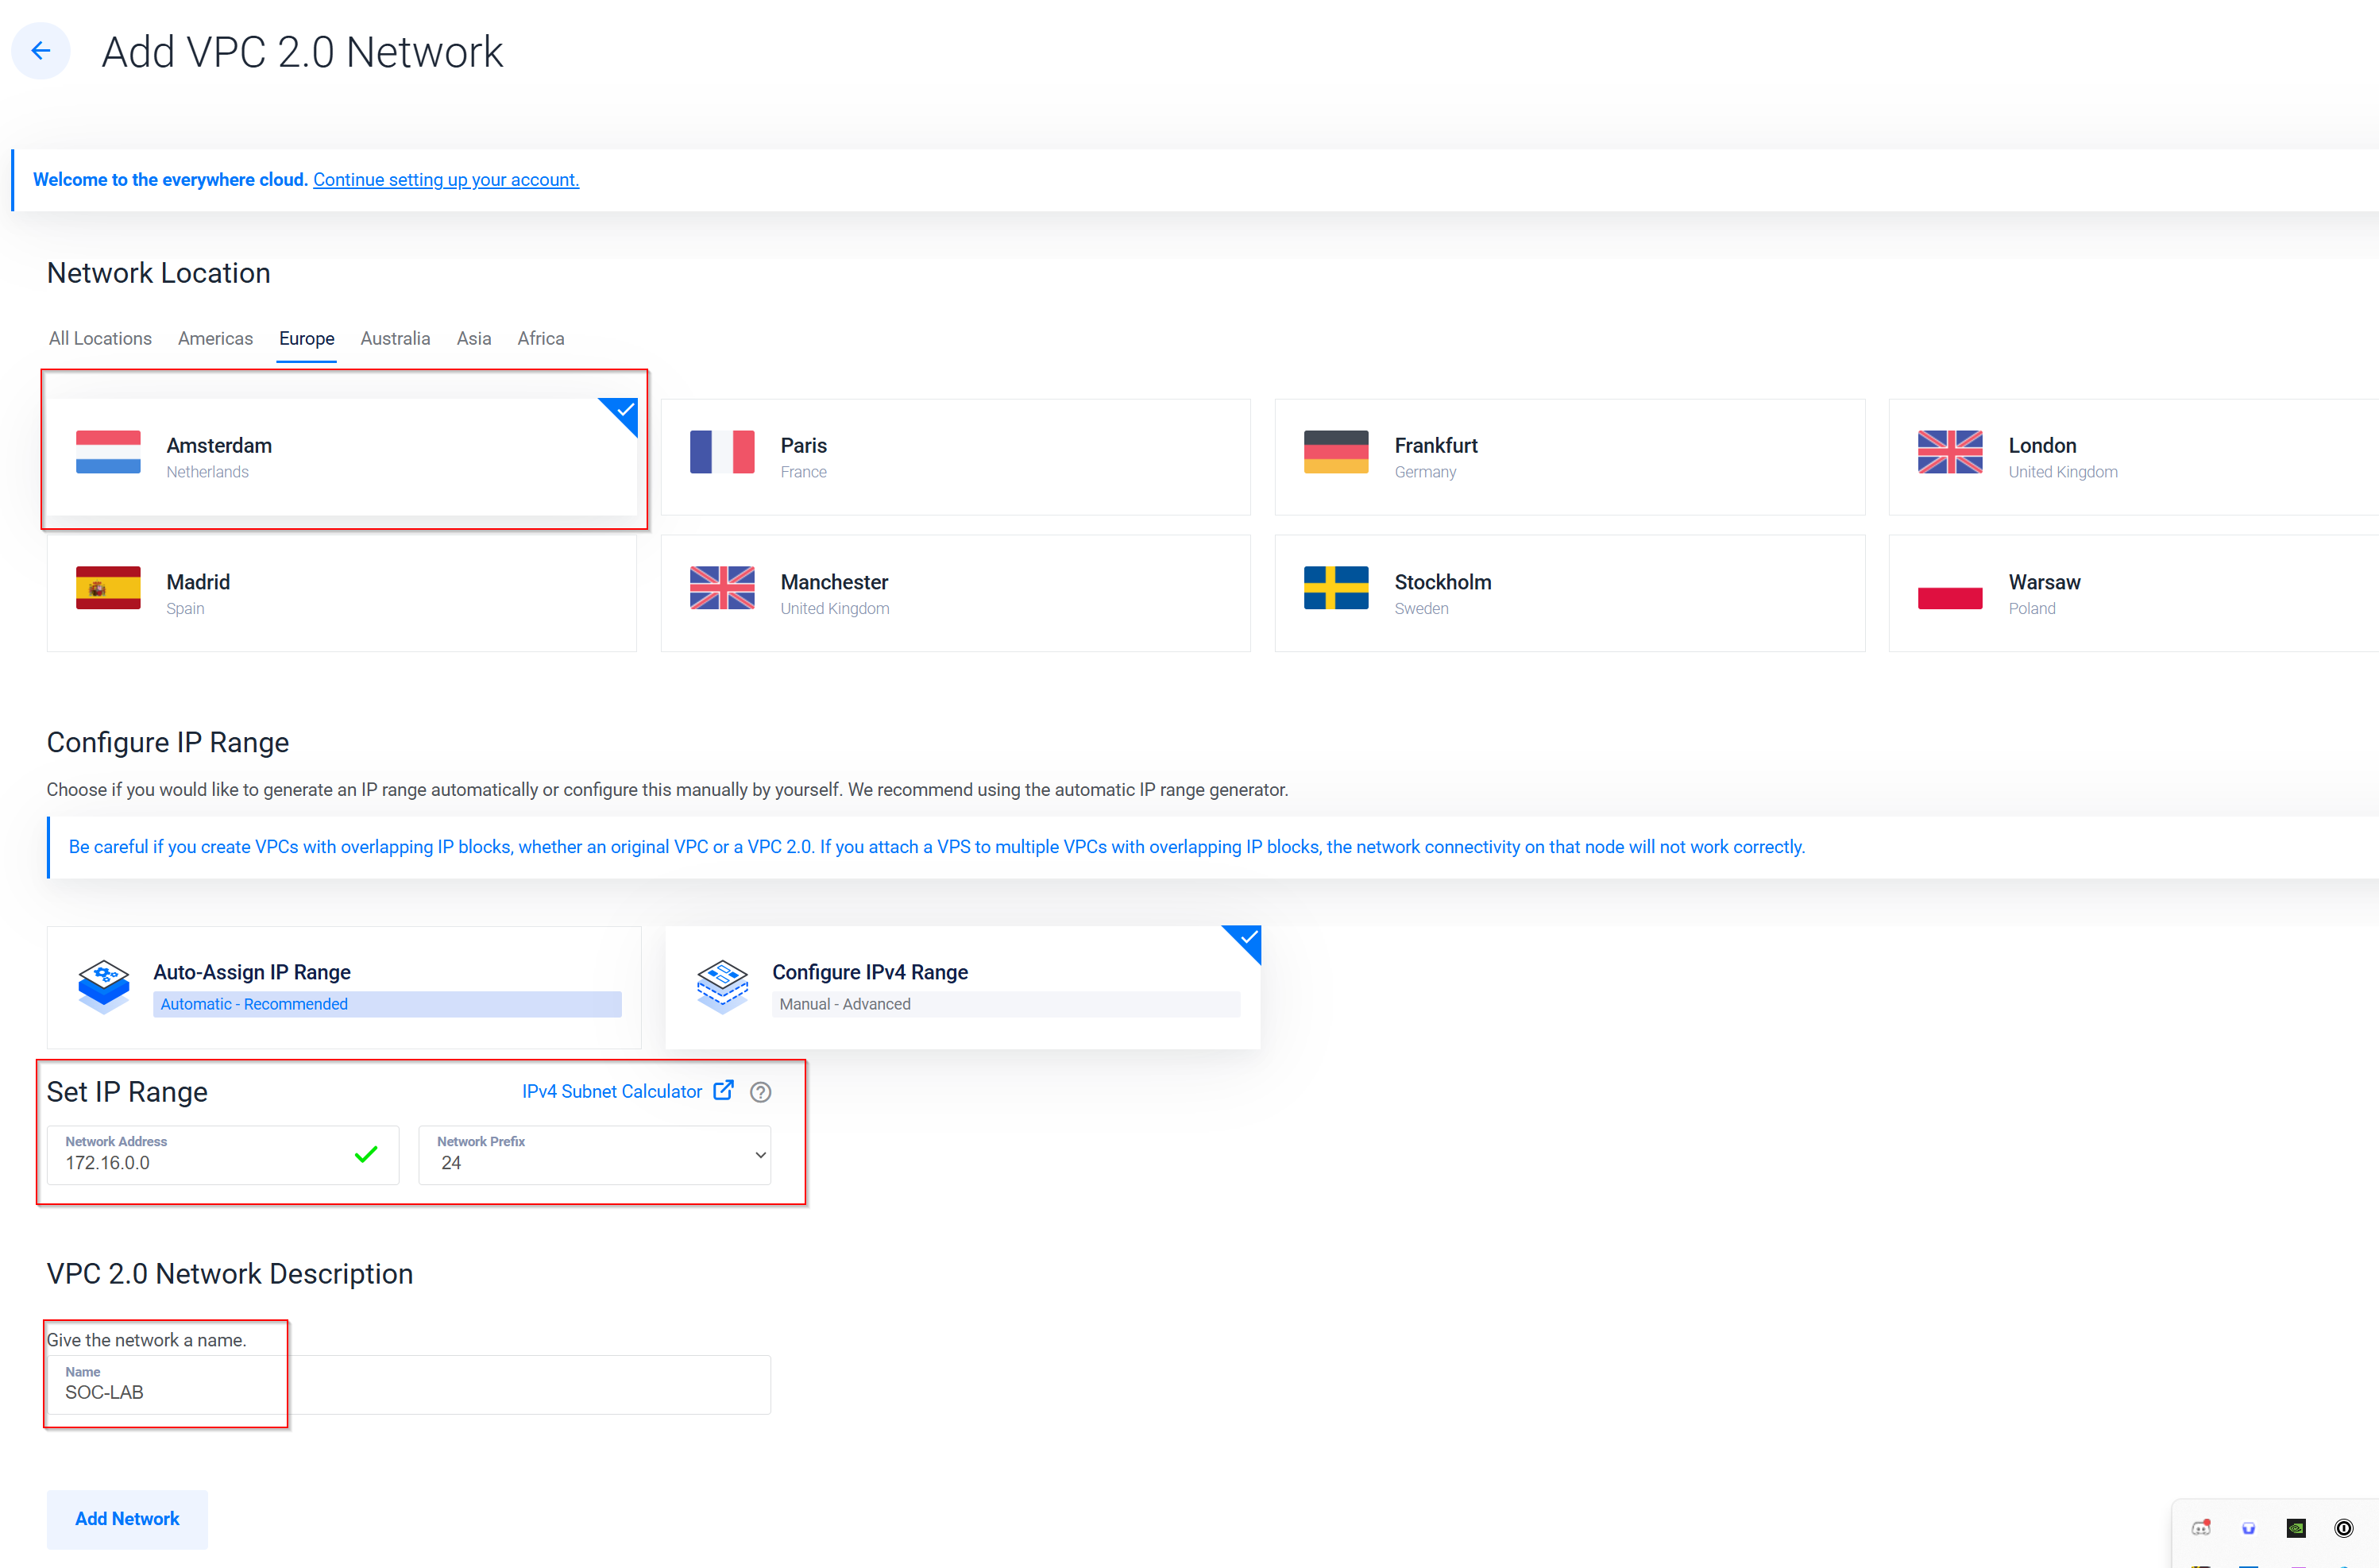
Step 3: Configuring Your VPC Click on Add VPC and choose your network location (e.g., Amsterdam). Pro Tip: Make sure that all your virtual machines are in the same location as your VPC to ensure smooth communication. 🌍 Under Configure IP Range, select Configure IPv4 Range and use the network address 172.16.0.0/24. Name your network something relevant, like SOC -Challenge, and then click Add Network.
❶ Deploying Your Virtual Machine
💻**Step 1: Creating a New Server**
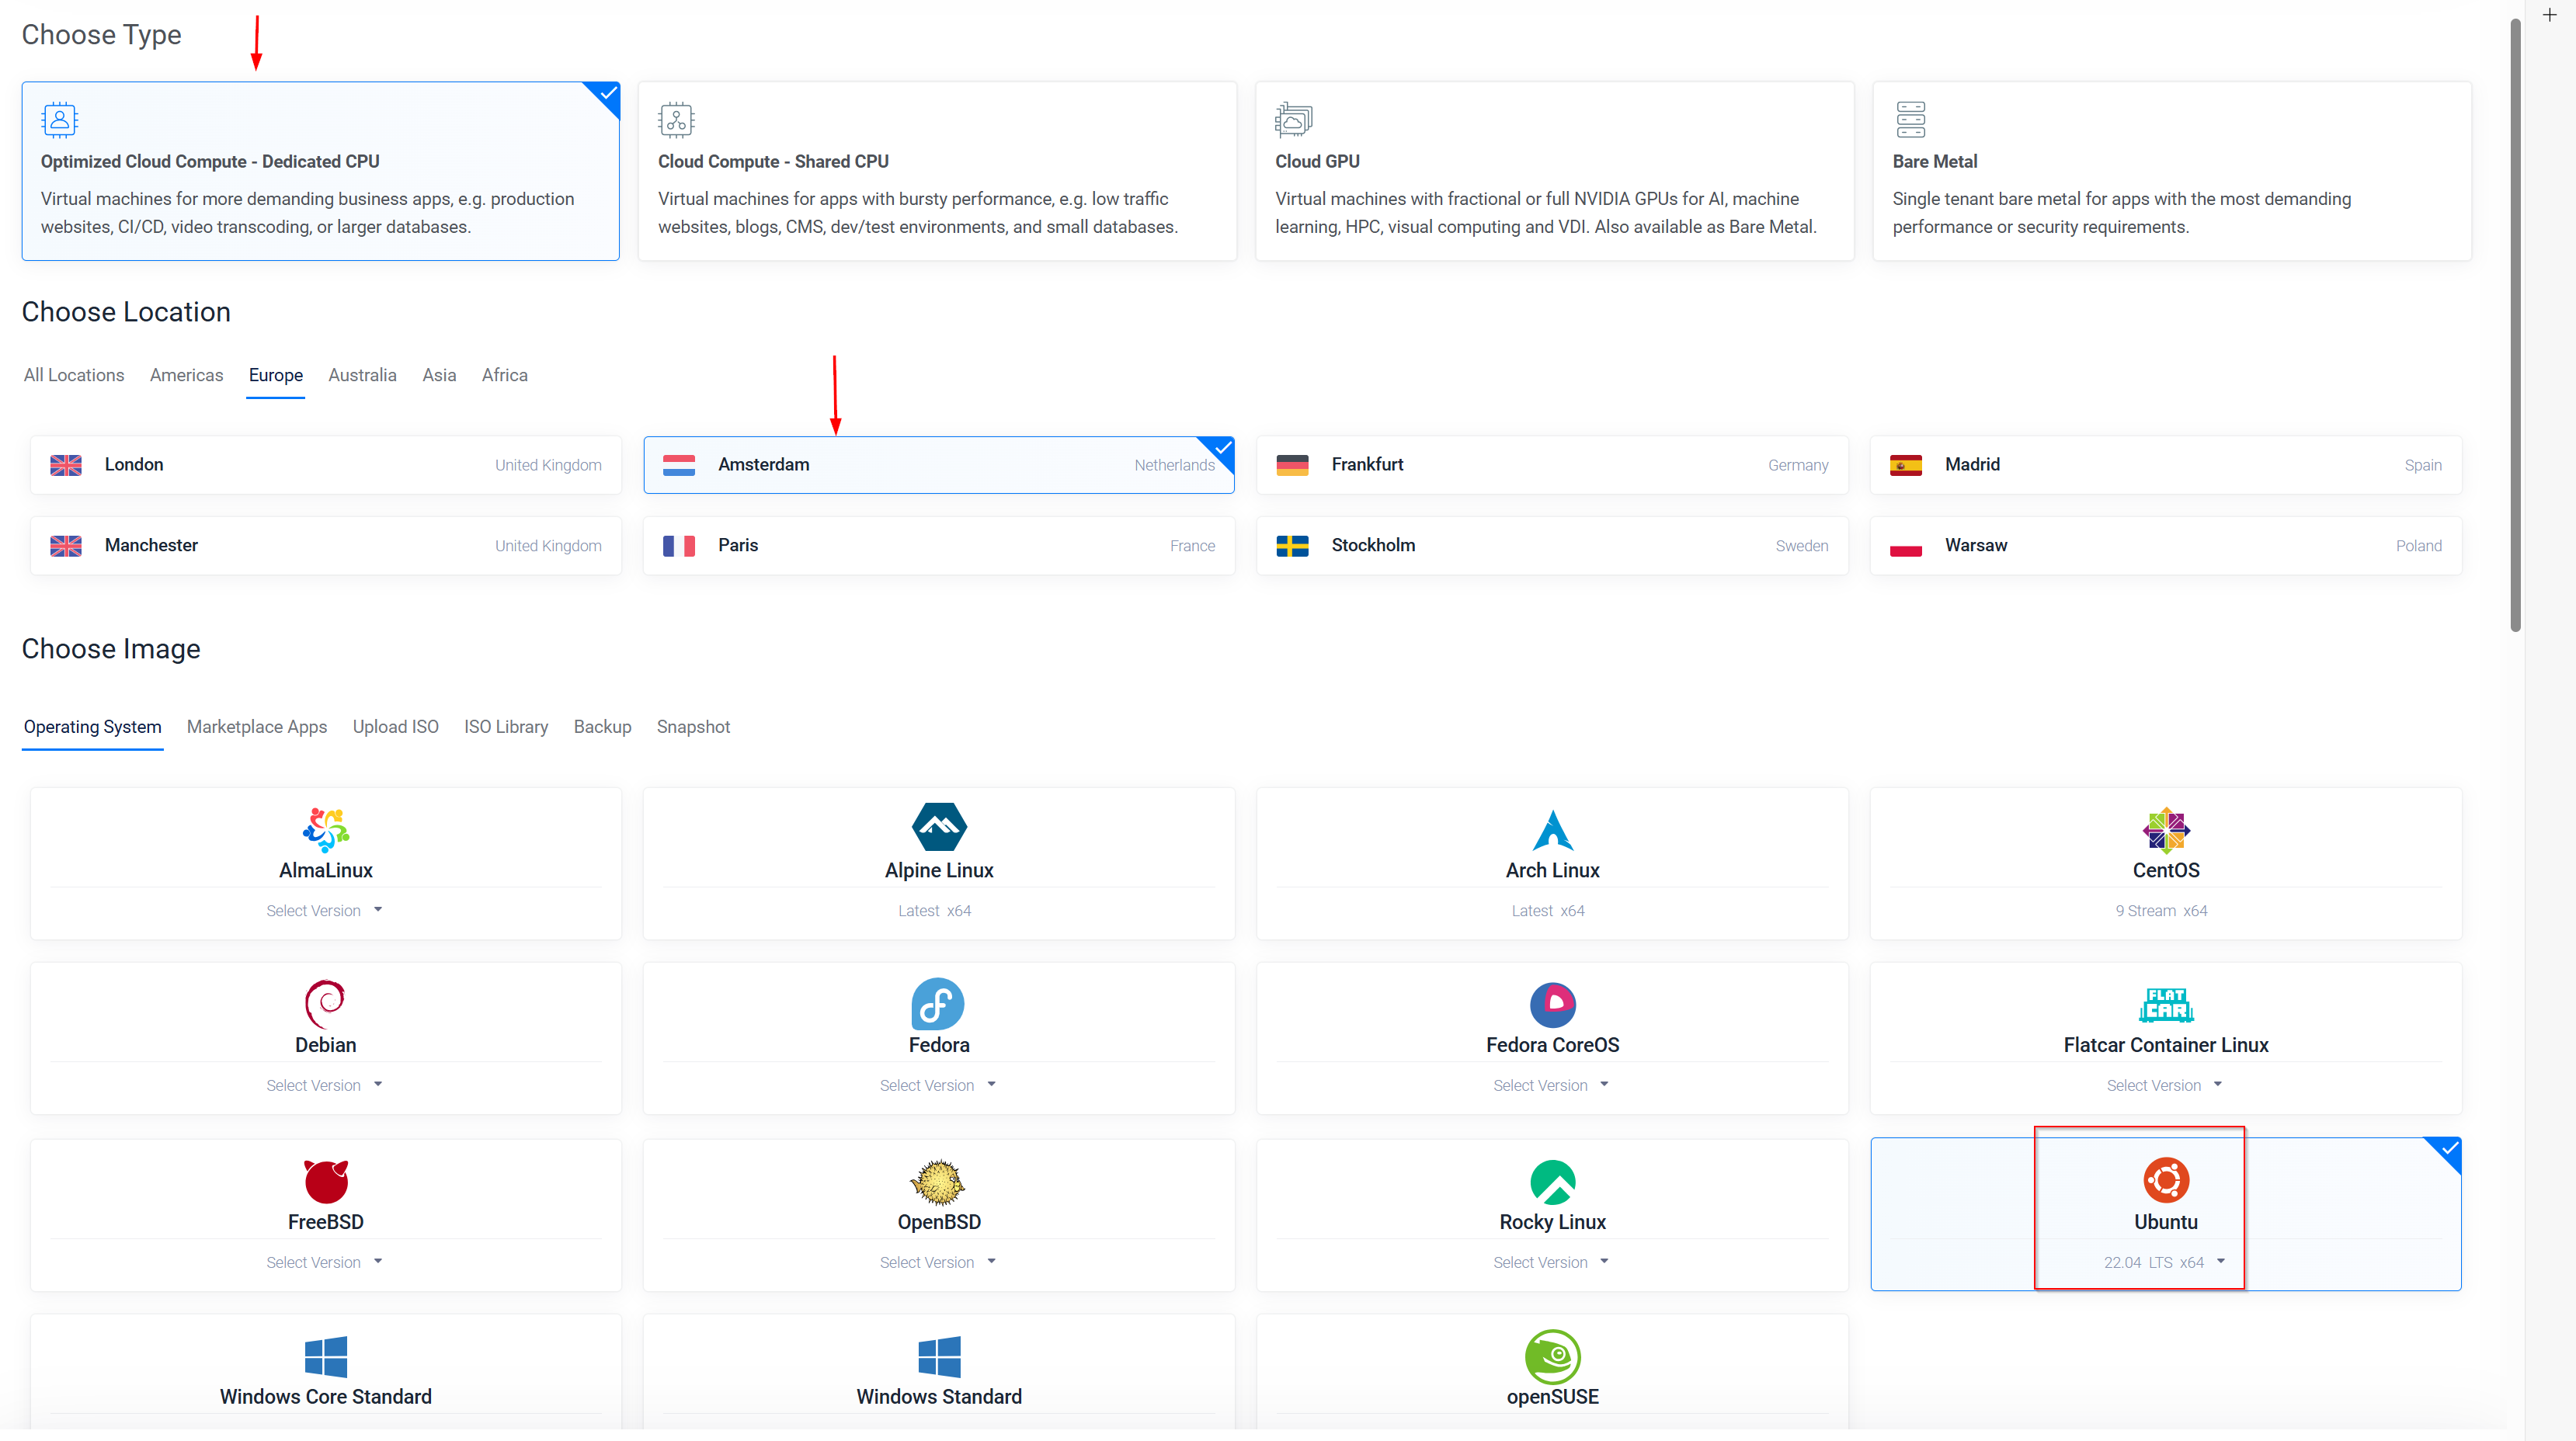
Click on Deploy in the top-right corner and choose Deploy New Server. Ensure the location matches your VPC’s location (e.g., Toronto) to keep everything in sync
🗃️Step 2: Choosing Your Image
Scroll down to the Choose Image section and pick Ubuntu 20.04 (64-bit) as your operating system.
Choose a server size that fits the requirements of Elasticsearch, such as a server with 4 virtual CPUs and 16 GB of RAM.
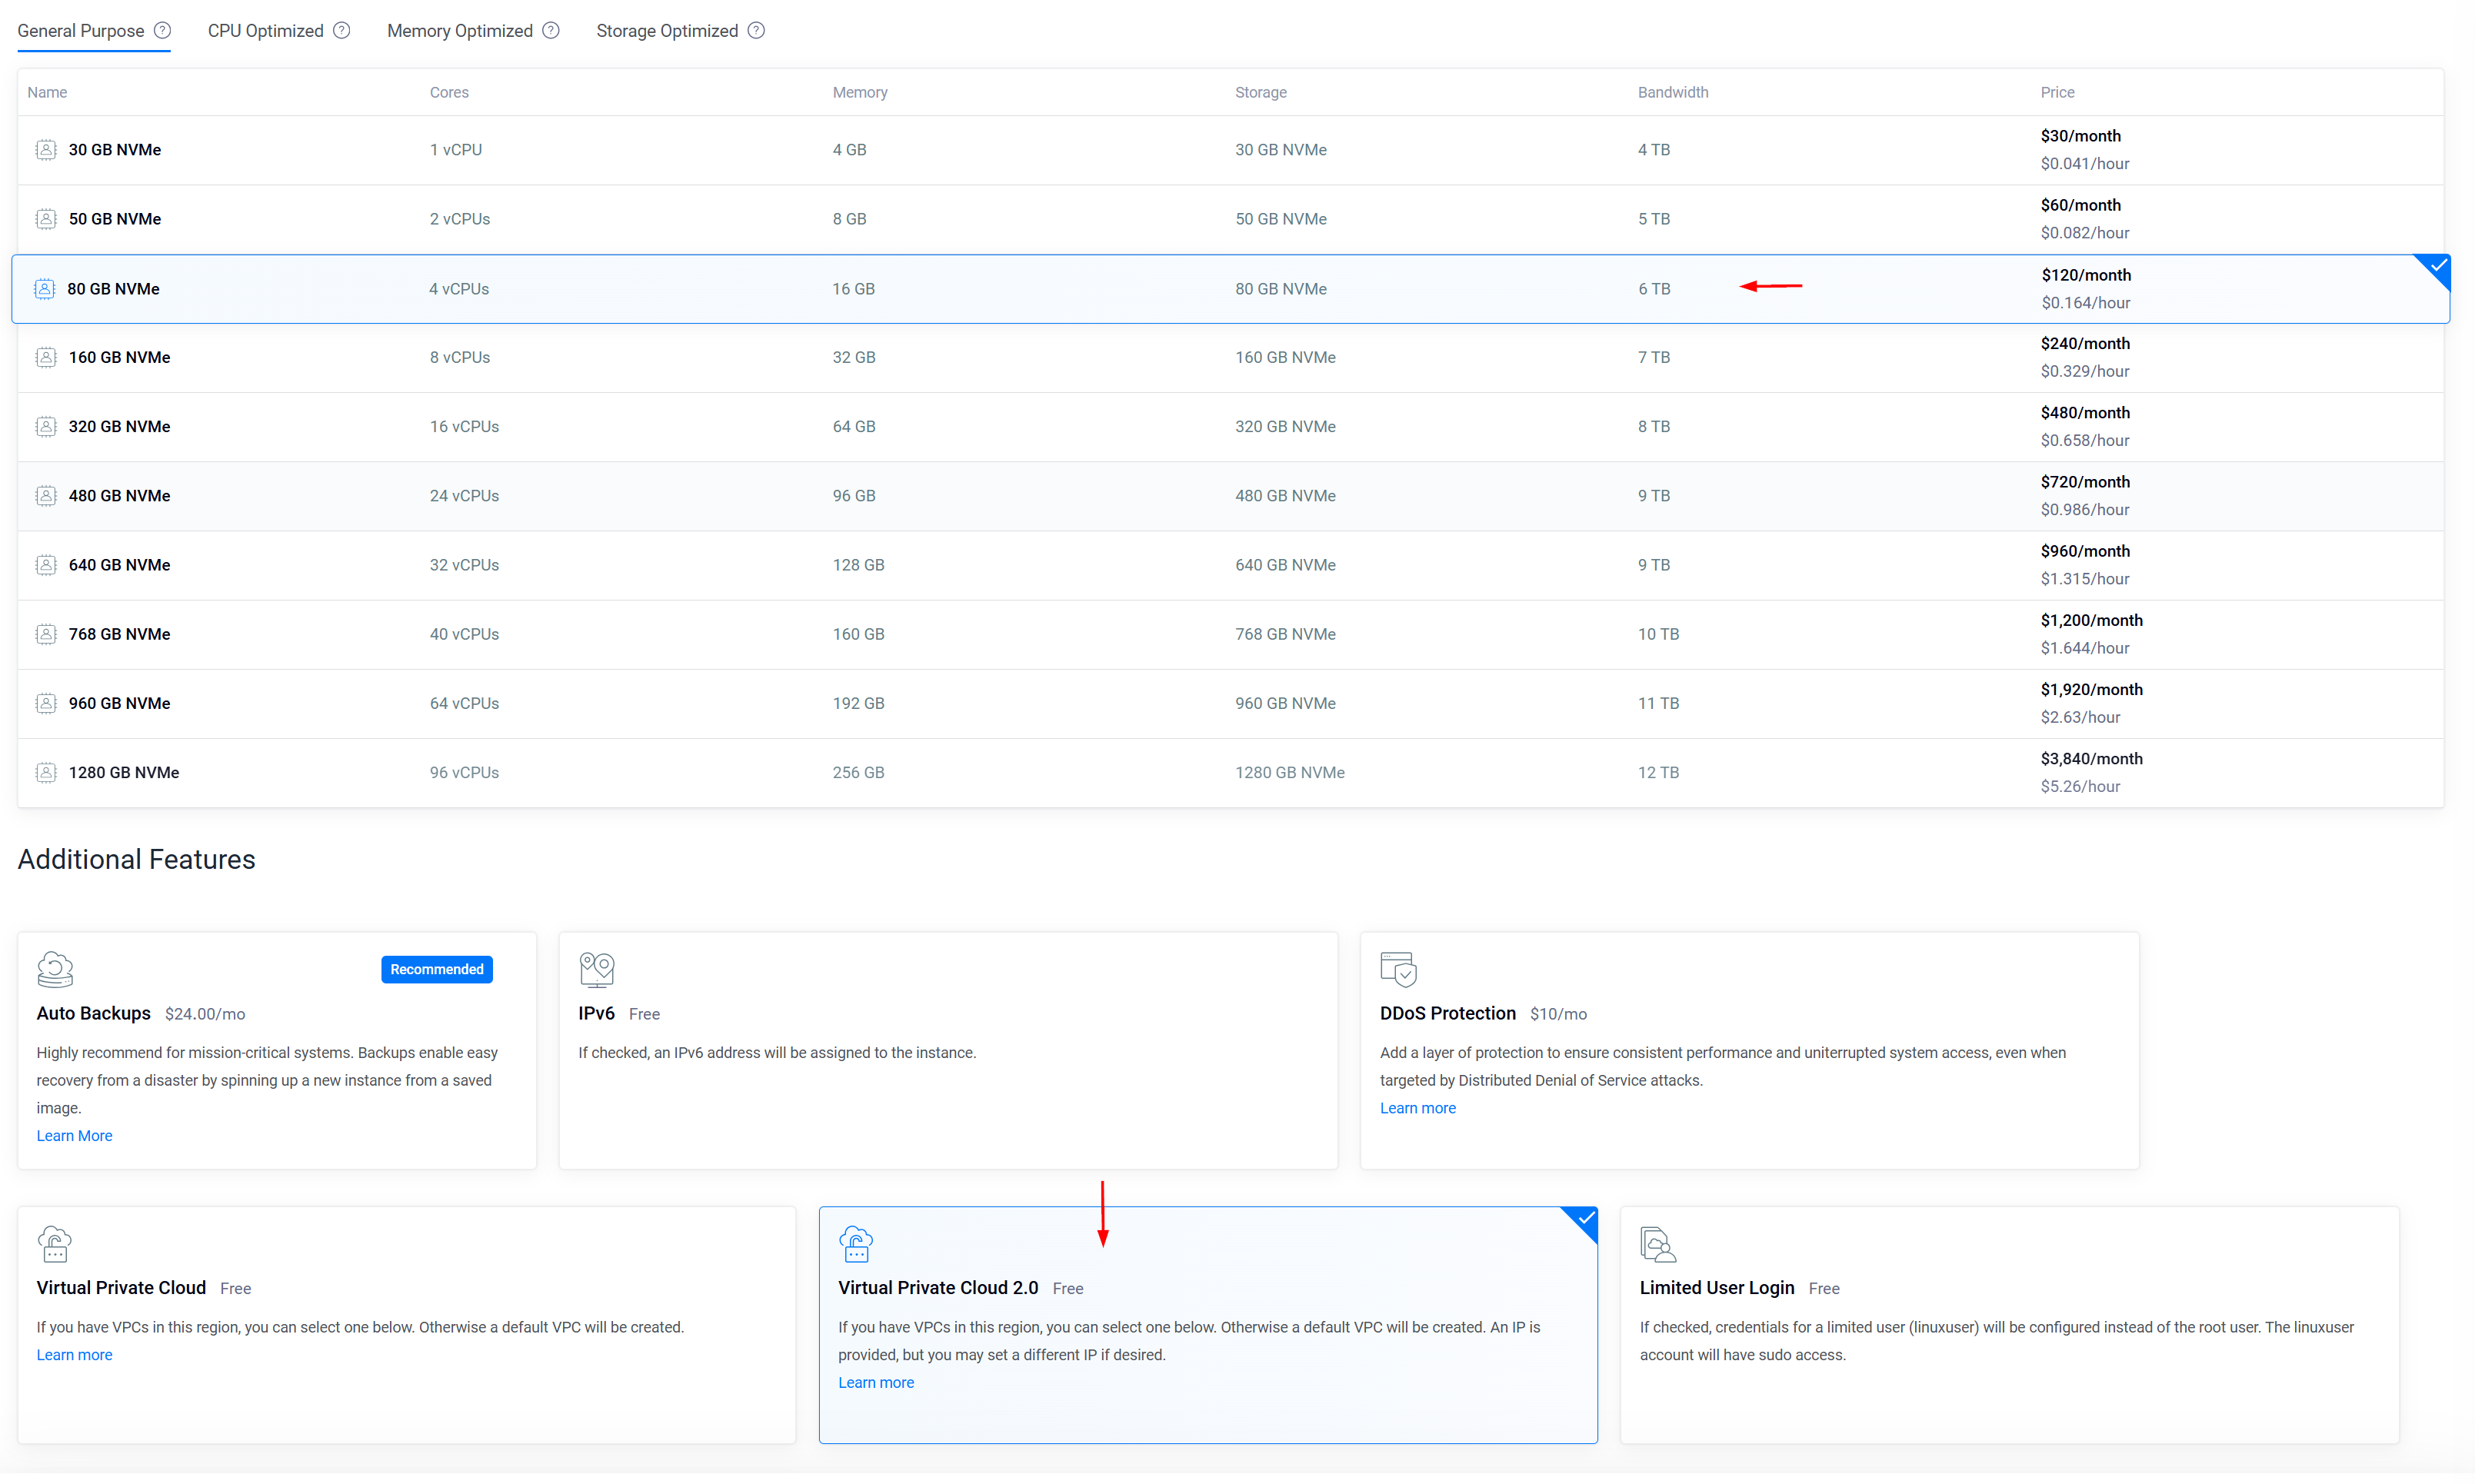
📶Step 3: Configuring Network and Firewall Settings Turn off Auto Backups and IPv6 since they’re not needed for our current setup. Select Virtual Private Cloud 2.0 and ensure your previously created VPC (e.g. SOC Challenge VPC) is selected. Note down the IP address provided, as you’ll need it later. ✍🏻
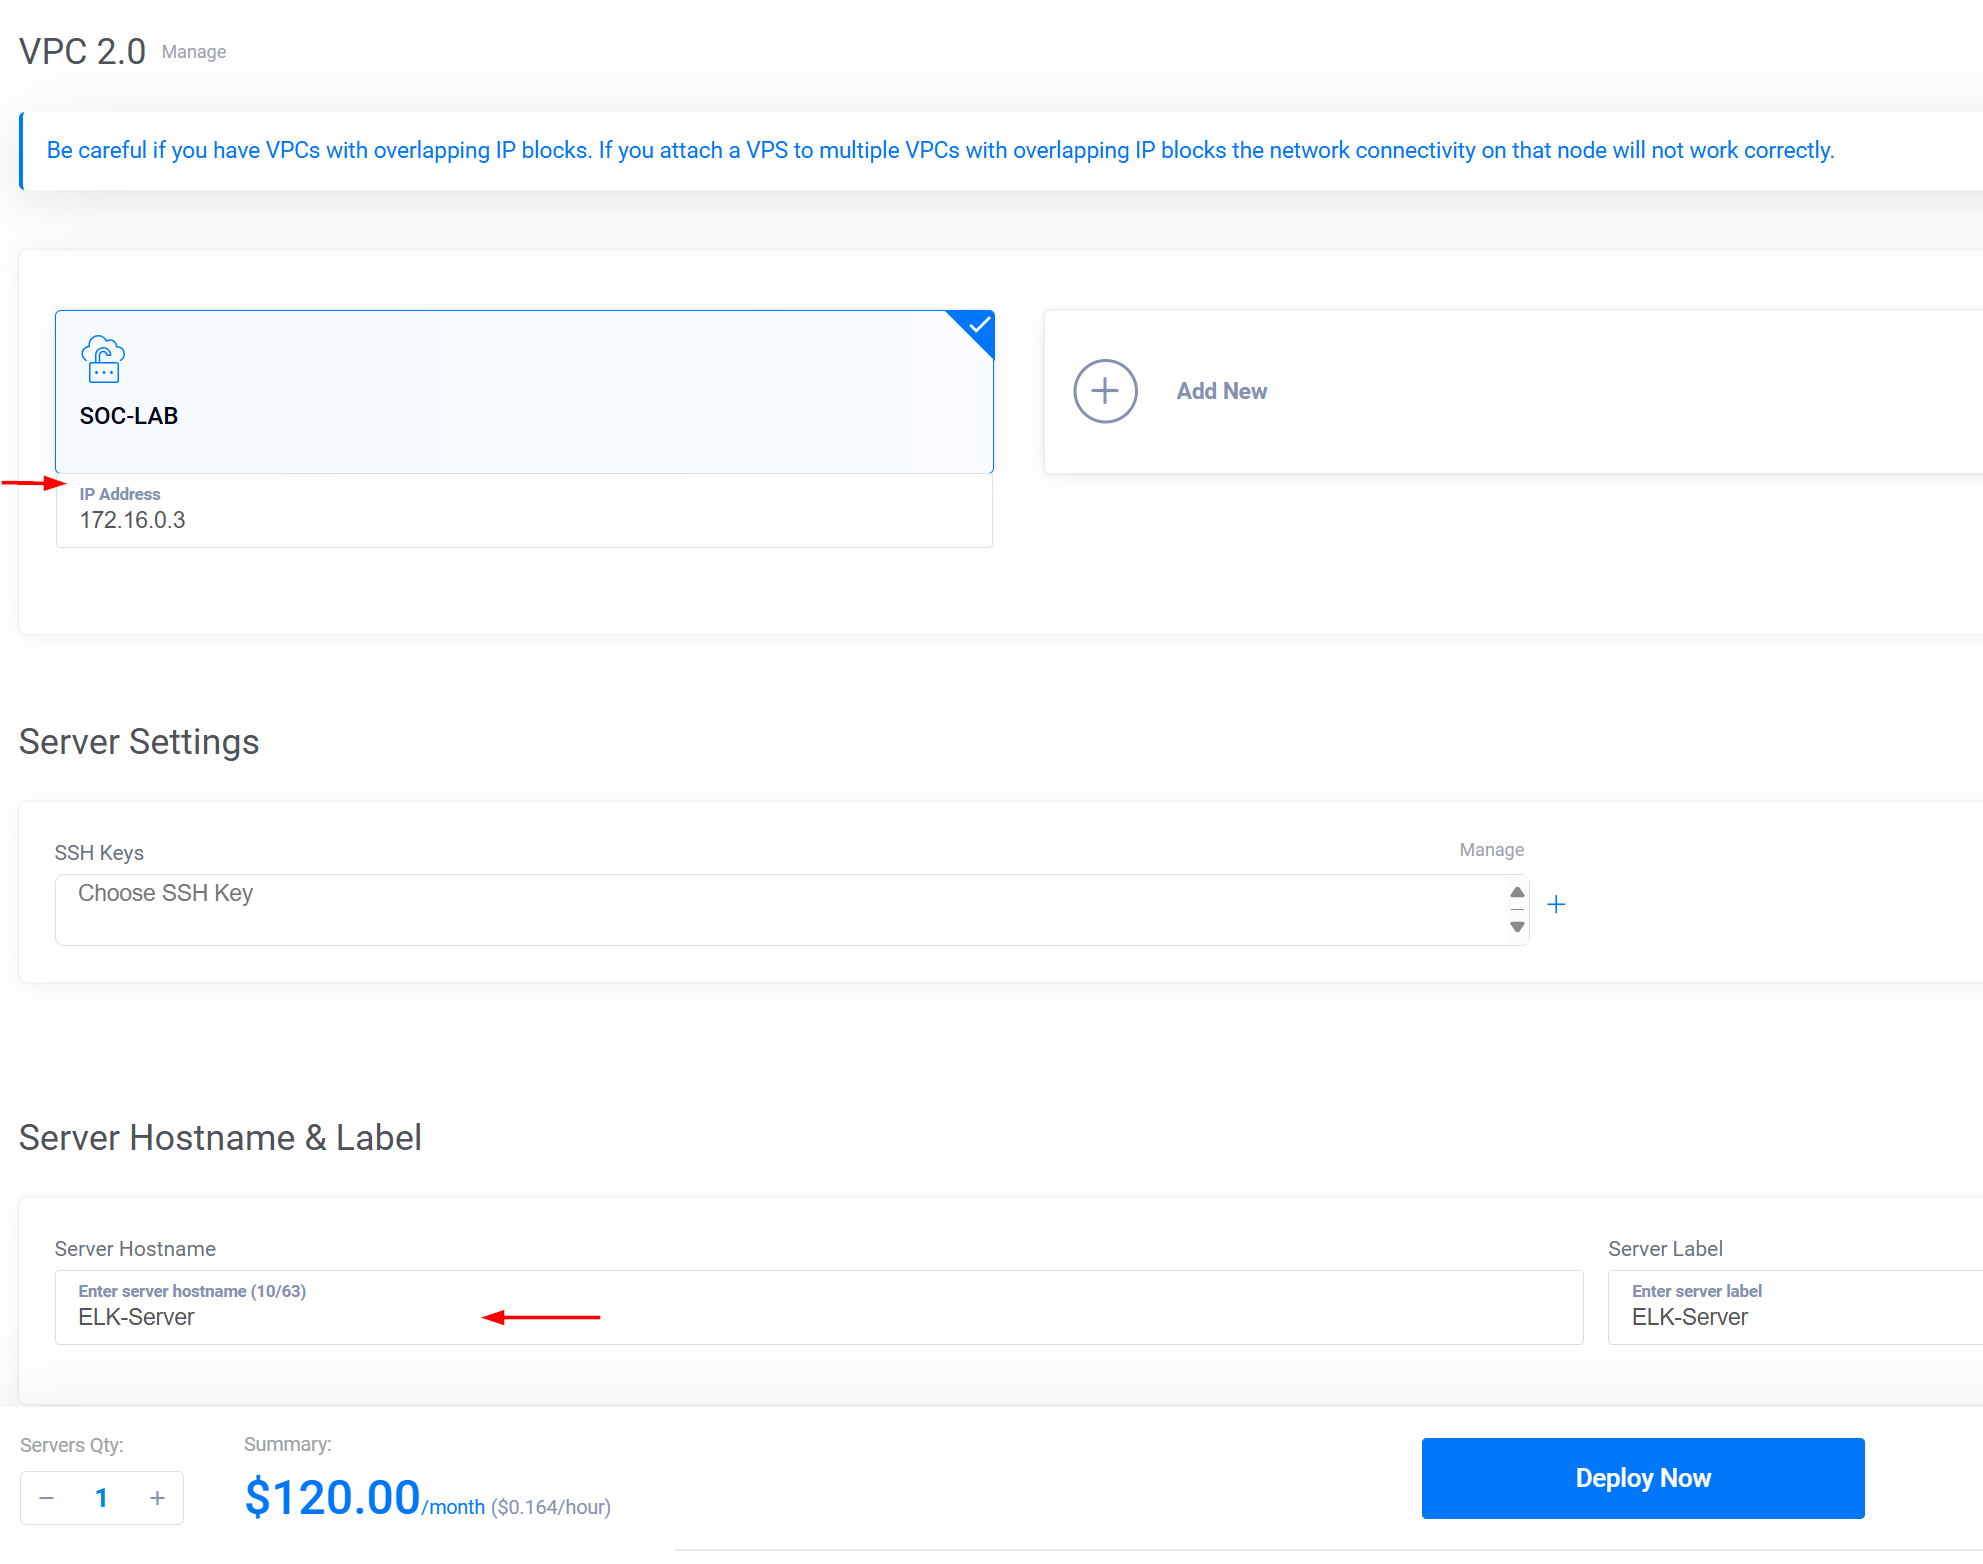
✔️ Step 4: Finalizing the Setup For the hostname, use something relevant like Elk-Server. Finally, click Deploy Now to kick off the deployment process.


𝟑 Accessing Your Virtual Machine Once your server is up and running, access it via SSH:
Open Command Prompt and use the following command to SSH into your server:
ssh root@[your-public-IP-address]
Replace [your-public-IP-address] with the actual IP on your Machine you can find that on the compute tab. 🔄 Step 2: Updating Repositories Once logged in, clear the screen by typing clear, and then update the system repositories with:
apt-get update && apt-get upgrade -y
](https://forensicfossil.com/content/images/20240927034448-SOC-07.png)
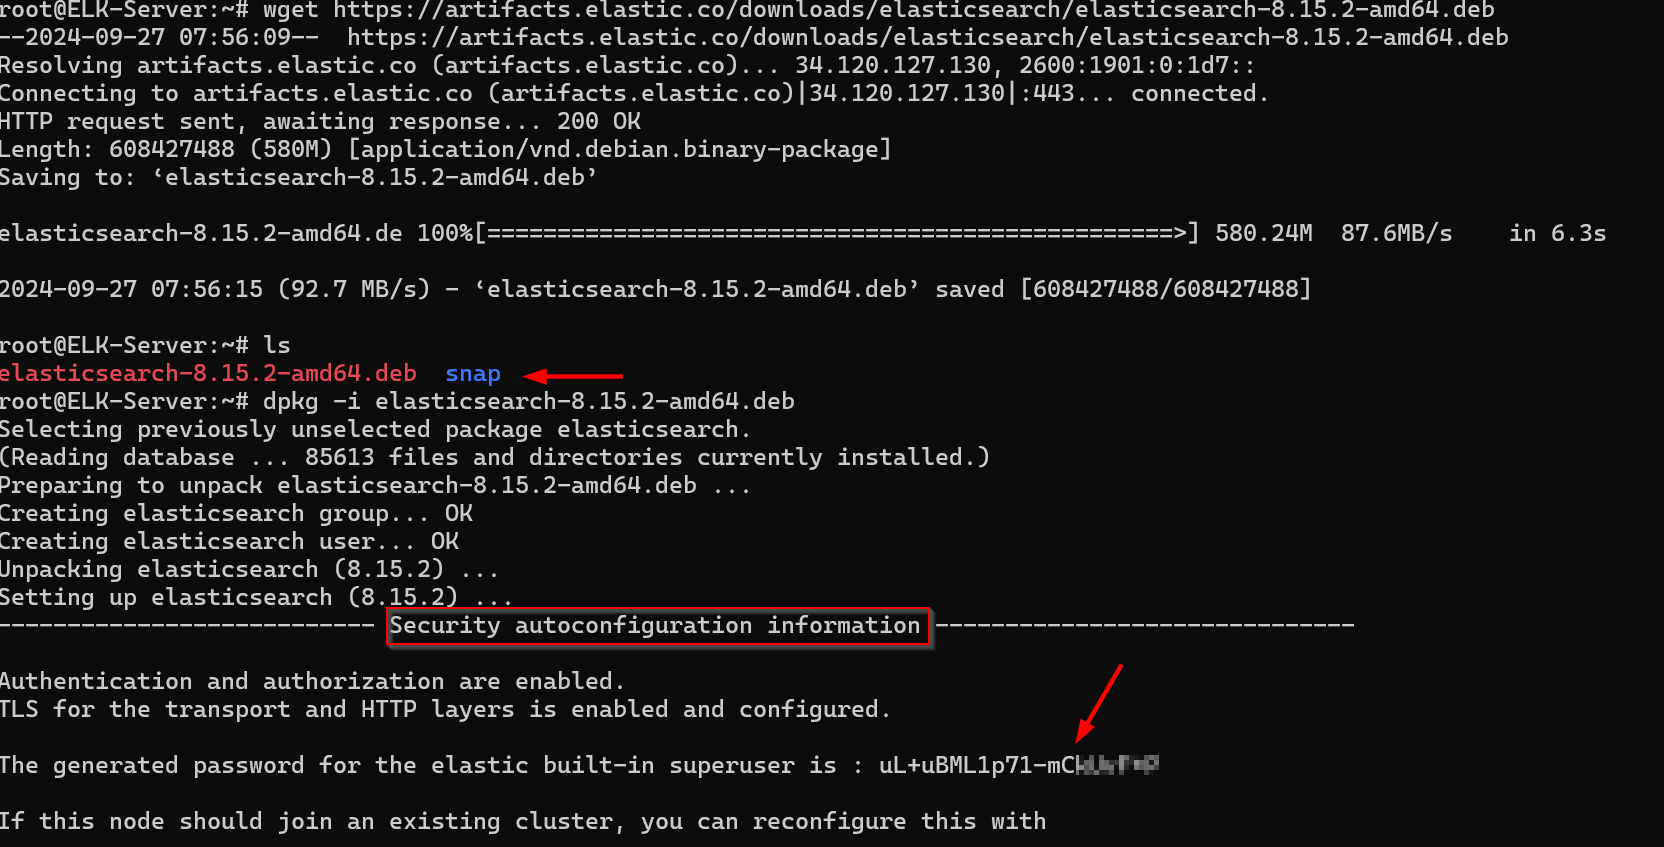
Ч Installing Elasticsearch 𖦹 Step 1: Downloading Elasticsearch Search for Elasticsearch and select the appropriate version for Ubuntu (Deb x86_64). Copy the download link and use the wget command to download Elasticsearch:
wget [your-copied-link]
Replace [your-copied-link] with the actual link you copied. ⤹ Step 2: Installing Elasticsearch Once downloaded, install Elasticsearch with:
dpkg -i elasticsearch-[version].deb
](https://forensicfossil.com/content/images/20240927040102-SOC-008.png)
🗝🔒 Step 3: Saving Configuration Details During the installation, Elasticsearch will present security auto-configuration details, including the password for the built-in superuser. Be sure to save these details in Notepad. 📝
5 Configuring Elasticsearch 🔧 Step 1: Accessing Configuration Files Navigate to the Elasticsearch configuration directory:
cd /etc/elasticsearch
Open the elasticsearch.yml configuration file:
nano elasticsearch.yml
🌐 Step 4: Configuring Network Host By default, Elasticsearch is only accessible via localhost (127.0.0.1). To allow access from your SOC analyst laptop:
- Remove the comment (#) from network.host.
- Replace the existing IP address with your server’s public IP address or 0.0.0.0
- Remove the comment (#) from http.port
- Save your changes and exit the editor. 💾
6️ Securing Elasticsearch with Firewalls 🛡️ Step 1: Creating a Firewall Group In Vultr, go to Settings for your virtual machine, select Firewall, and click Manage. Create a new firewall group named something like SOC-Lab FW.
🔒 Step 2: Configuring Firewall Rules SSH access is allowed from anywhere by default, but for added security, restrict it to your IP address. Apply the newly created firewall group to your virtual machine.
7️ Starting Elasticsearch ▶️ Step 1: Starting the Service Start the Elasticsearch service with the following commands:
systemctl daemon-reload
systemctl enable elasticsearch.service
systemctl start elasticsearch.service
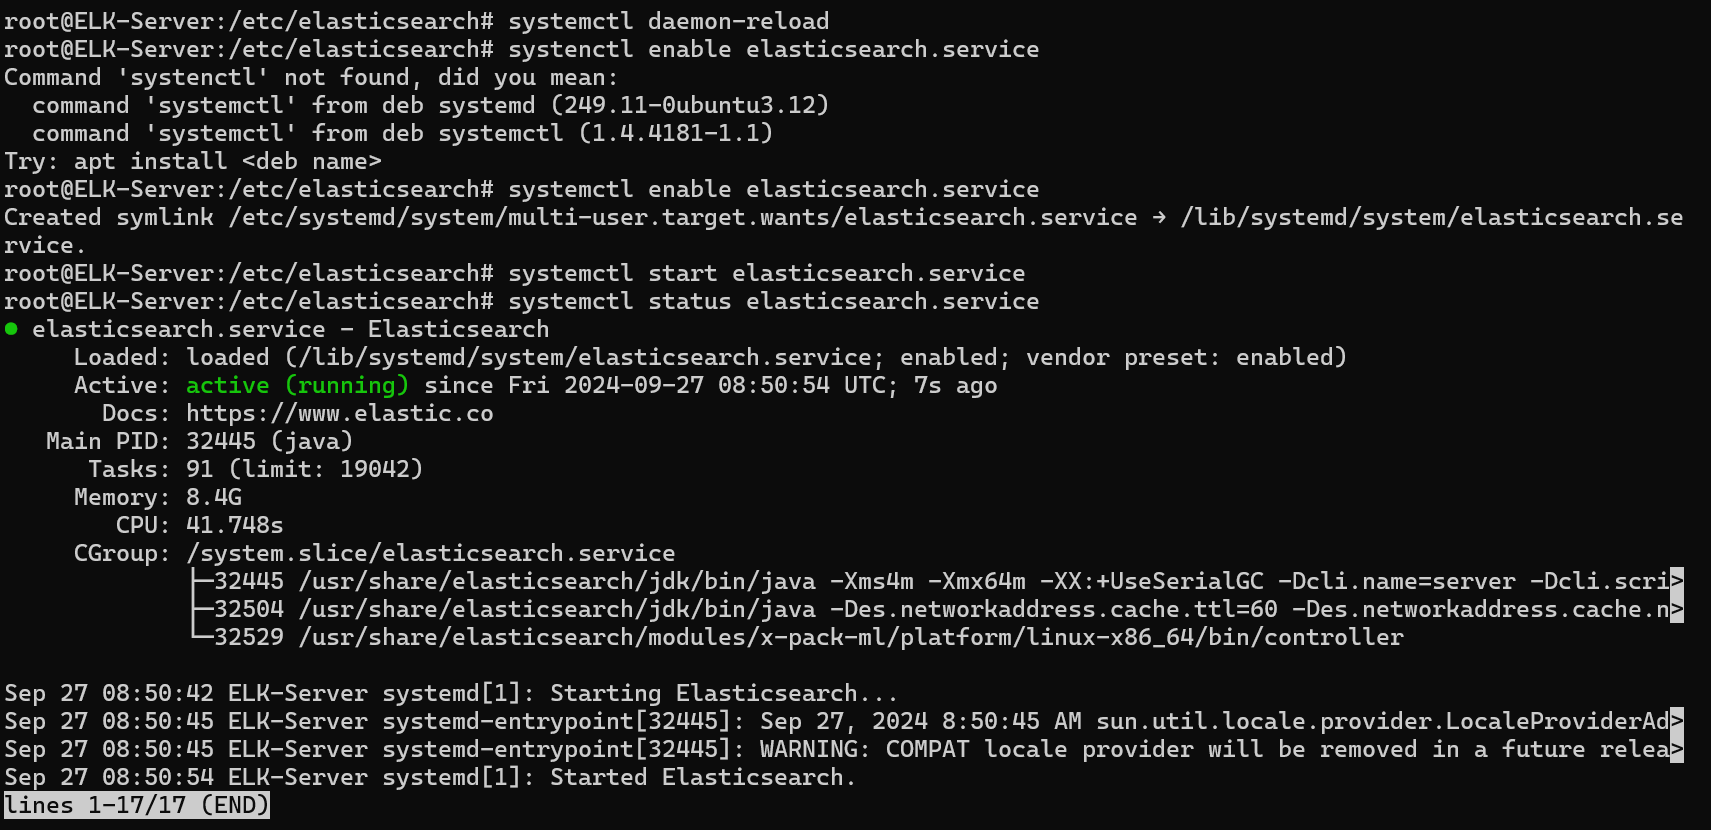
🟢 Step 2: Verifying Elasticsearch is Running
Check the status of Elasticsearch to ensure it’s active and running:
systemctl status elasticsearch.service
🎯8️ Setting Up Kibana To begin, you’ll need to download Kibana from the Elastic website. Here’s how:
- Navigate to Elastic Downloads:
Head over to elastic.co/downloads/kibana. Choose Debian x86 64 from the dropdown menu.
- ** Copy the Download Link:**
Right-click on the big blue Download button. Select Copy link address.
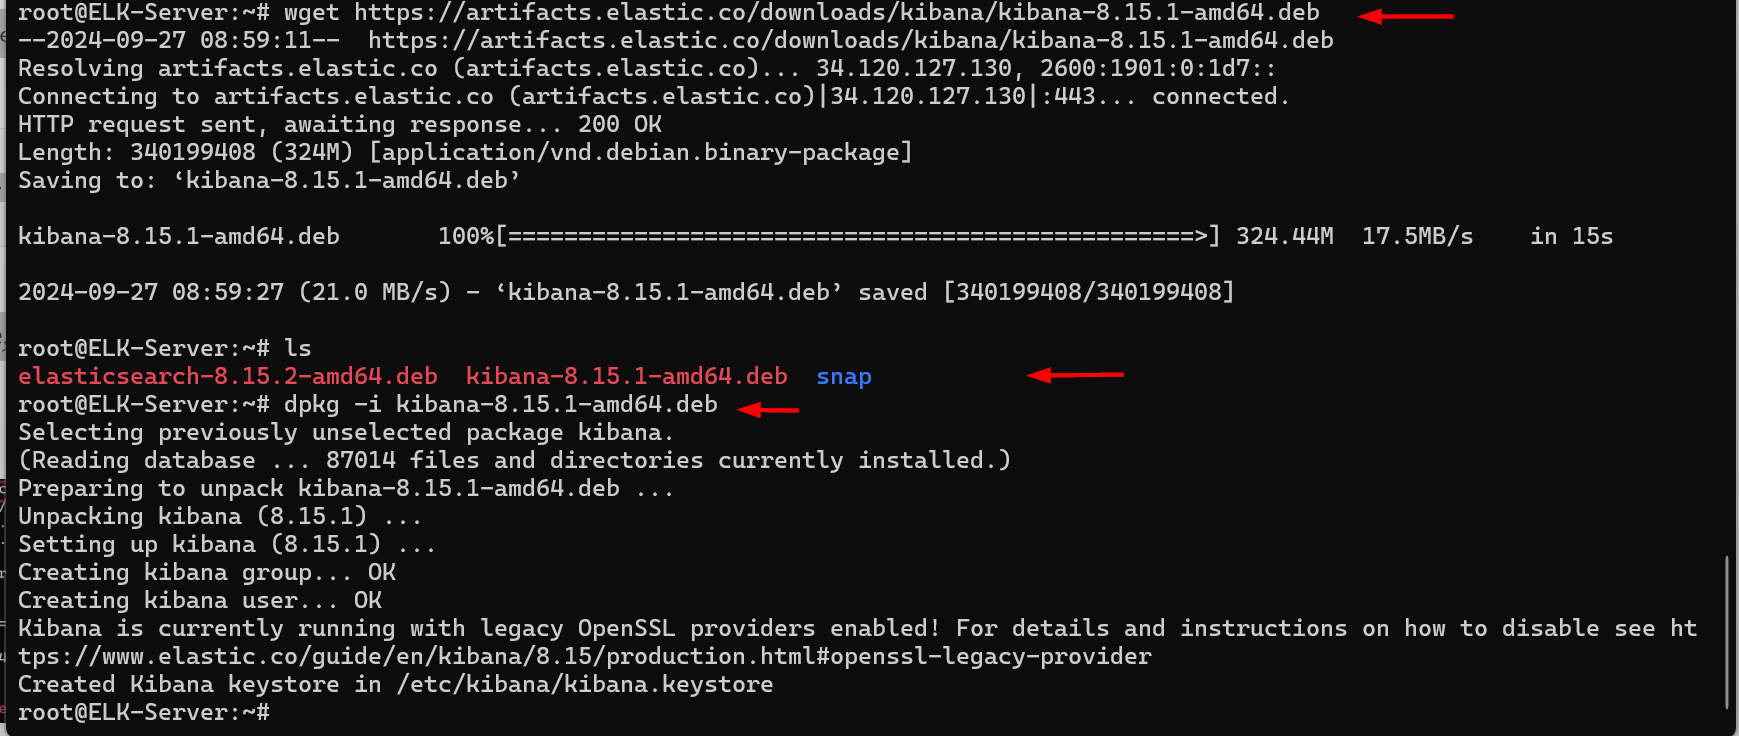
- Download Kibana via SSH:
In your SSH session, use the wget command to download Kibana.
wget <paste the link address here>
Once the download is complete, list the directory contents using ls to confirm the file is there.
4. Install Kibana: Install the downloaded package using the dpkg command:
dpkg -i kibana-<version>.deb
🔧 Configuring Kibana After installation, you need to make a few configuration changes:
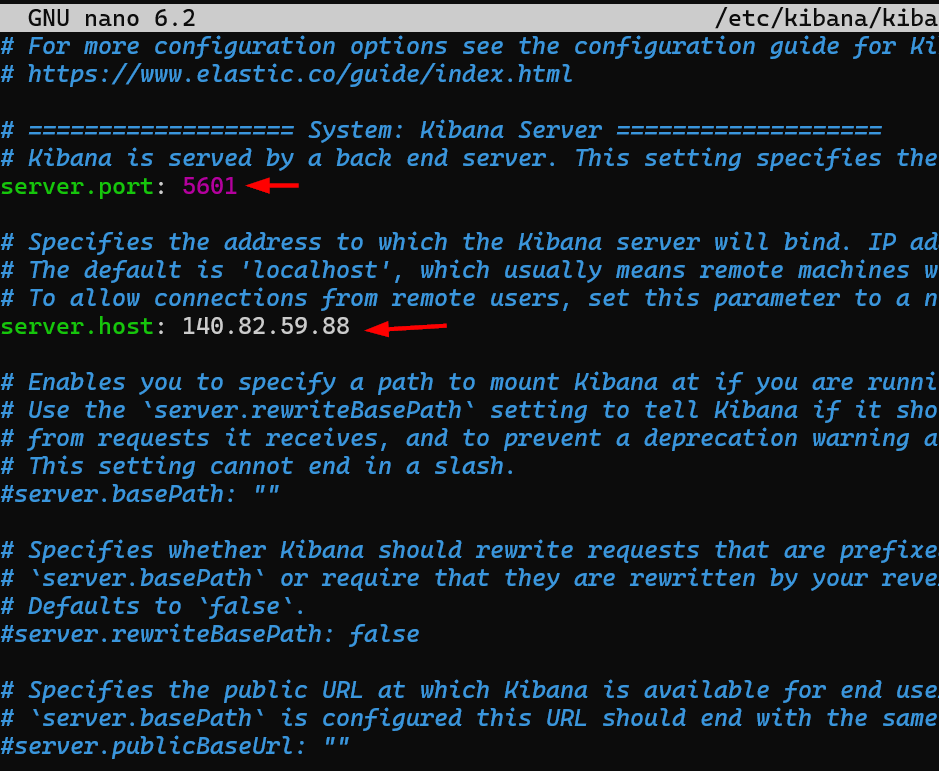
Open the Configuration File: Use nano to edit the configuration file located at /etc/kibana/kibana.yml:
nano /etc/kibana/kibana.yml
2. Modify the Server Settings:
Uncomment and set the server.port (default is 5601). Uncomment and change the server.host from localhost to your public IP address.
3. Save and Exit:
Press Ctrl + X, then Y to save the changes, and Enter to exit. 🚀 Starting Kibana With the configuration in place, it’s time to start Kibana:
Reload the System Daemons:
systemctl daemon-reload
2. Enable Kibana to Start at Boot:
systemctl enable kibana
Start the Kibana Service:
systemctl start kibana
Check the Service Status:
systemctl status kibana
You should see a message indicating that Kibana is active and running.
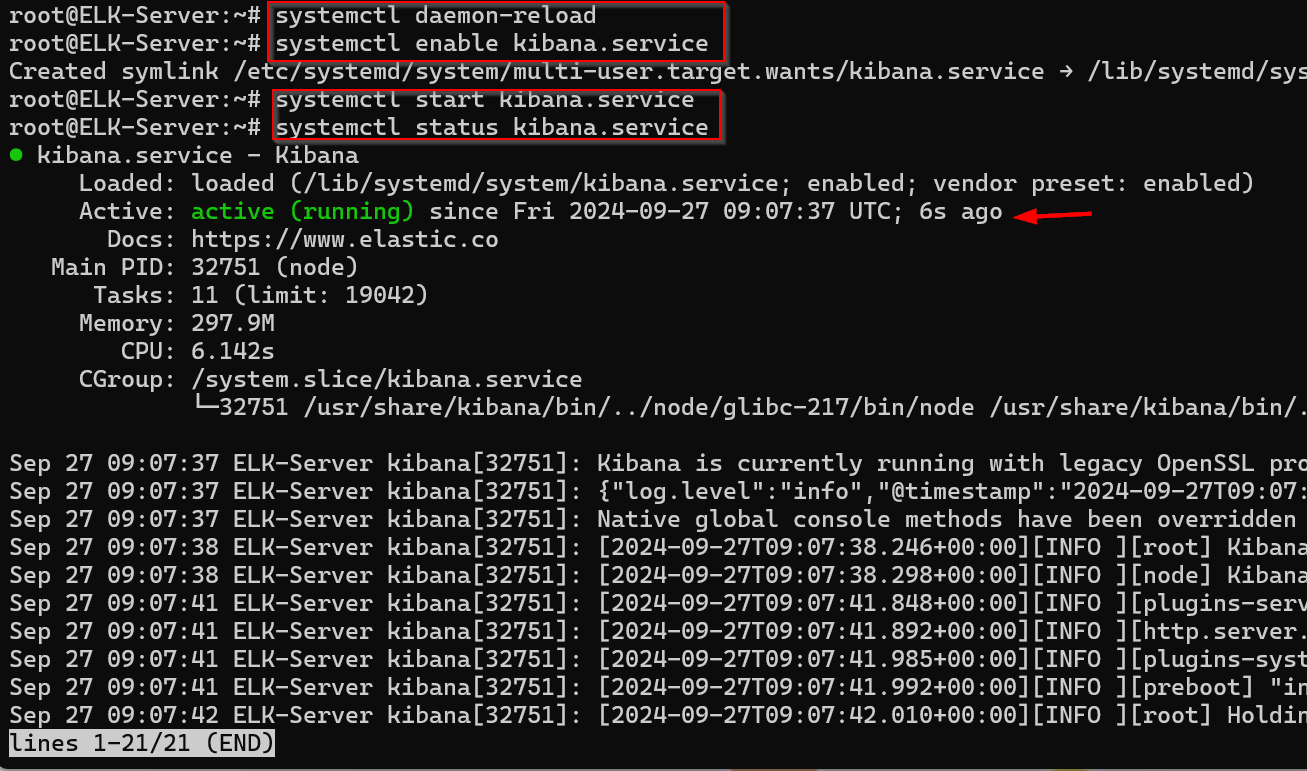
🔐 Generating an Elasticsearch Enrollment Token Before accessing Kibana, you’ll need to generate an Elasticsearch enrollment token:
Change Directory to Elasticsearch Binaries:
cd /usr/share/elasticsearch/bin
Generate the Enrollment Token:
./elasticsearch-create-enrollment-token --scope kibana
Copy the generated token and store it in a safe place.

On your Vultr instance, adjust the firewall settings to allow tcp traffic from [Your ip ] to port 1-65535 .

Allow Port 5601 on Ubuntu:
ufw allow 5601

9️ 🌐 Accessing Kibana To access Kibana:
Open Your Browser:
Type in your public IP followed by :5601 (e.g., http://
Refresh the browser to connect to Kibana. 🔑 Finalizing Kibana Setup After connecting to Kibana, you’ll need to complete a few more steps:
Enter the Enrollment Token: Paste the previously generated enrollment token when prompted.
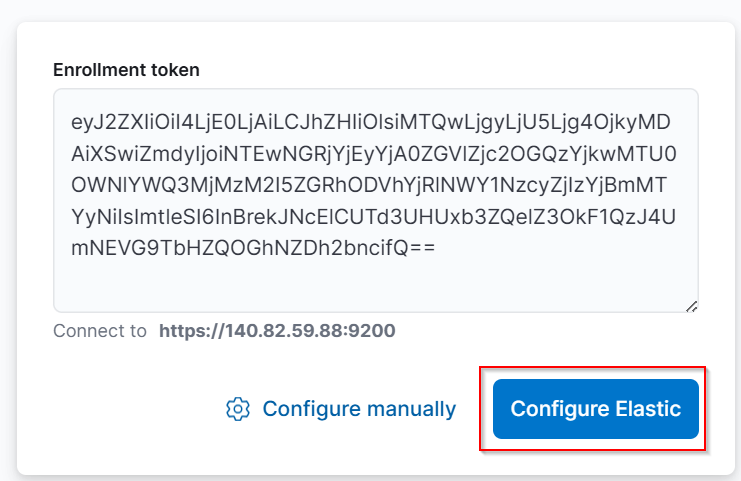
- Verification Code:
Retrieve the verification code from the Kibana server:
cd /usr/share/kibana/bin
./kibana-verification-code
Enter the code in the browser.
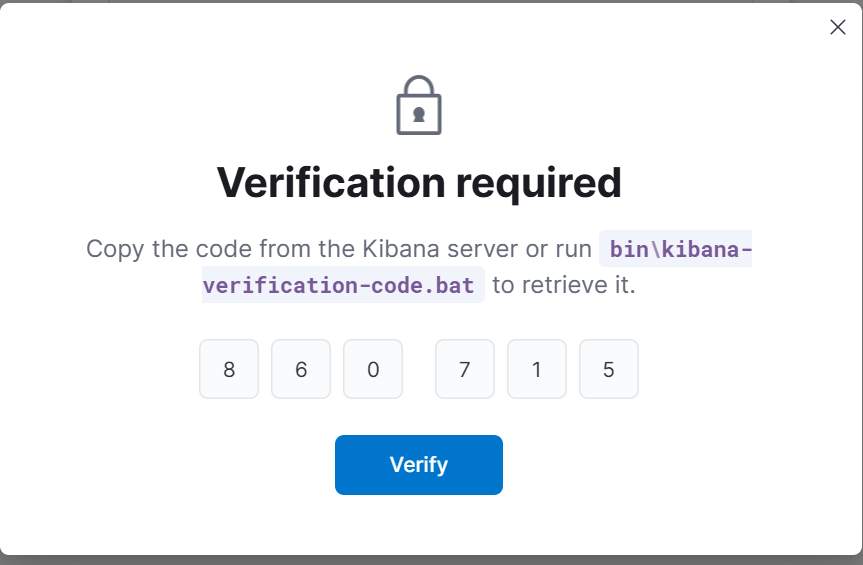
3. Login with Elasticsearch Credentials:
Use the default elastic user and the password provided during the Elasticsearch setup.
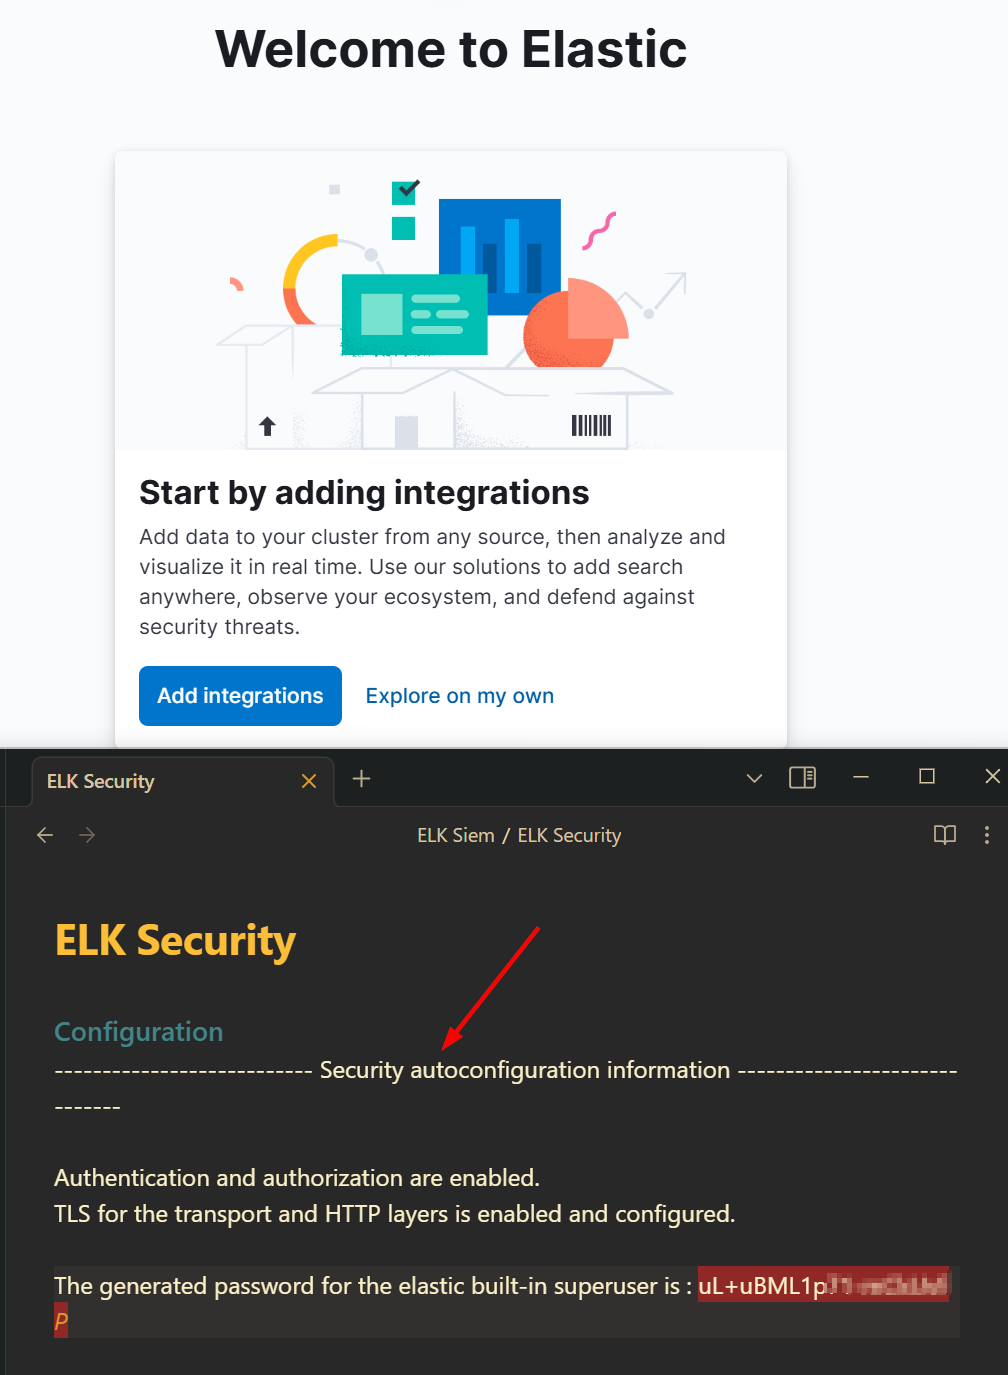
One Last configuration to setup the elasticsearch.
🔑 Setting Up Encryption Keys Kibana requires encryption keys for secure storage of saved objects: Navigate to :
cd /usr/share/kibana/bin
Generate Encryption Keys:
./kibana-encryption-keys generate
Copy the generated keys.
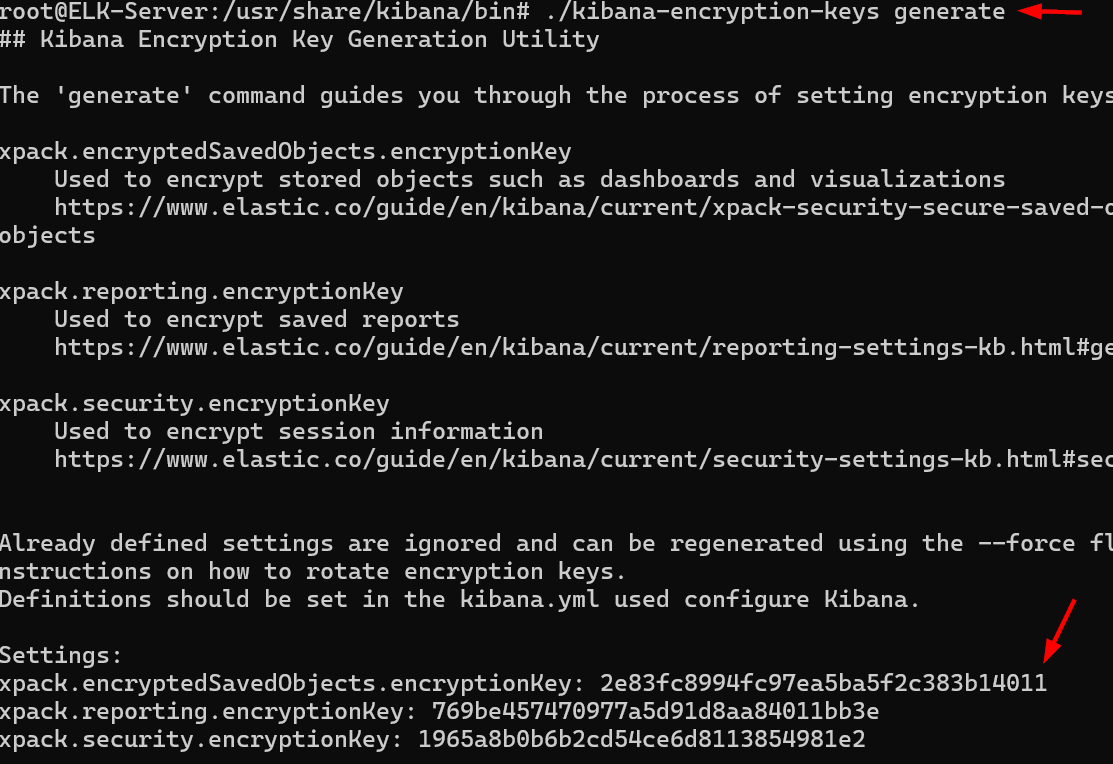
2. Add Keys to the Kibana Keystore:
Use the following command to add each key:
./kibana-keystore add xpack.encryptedSavedObjects.encryptionKey
Repeat for all three keys.

3. Restart Kibana:
systemctl restart kibana
🗄️|0 Setting Up Your Windows Server 2022
👨🏻💻**Step 1: Log in to Vultr **
To begin, head over to Vultr and log in with your account
⚙️Step 2: Configure Your Server **
Server Type: Select Cloud Compute — Shared CPU. Since this server doesn’t need to be highly resource-intensive, the shared CPU option will suffice.
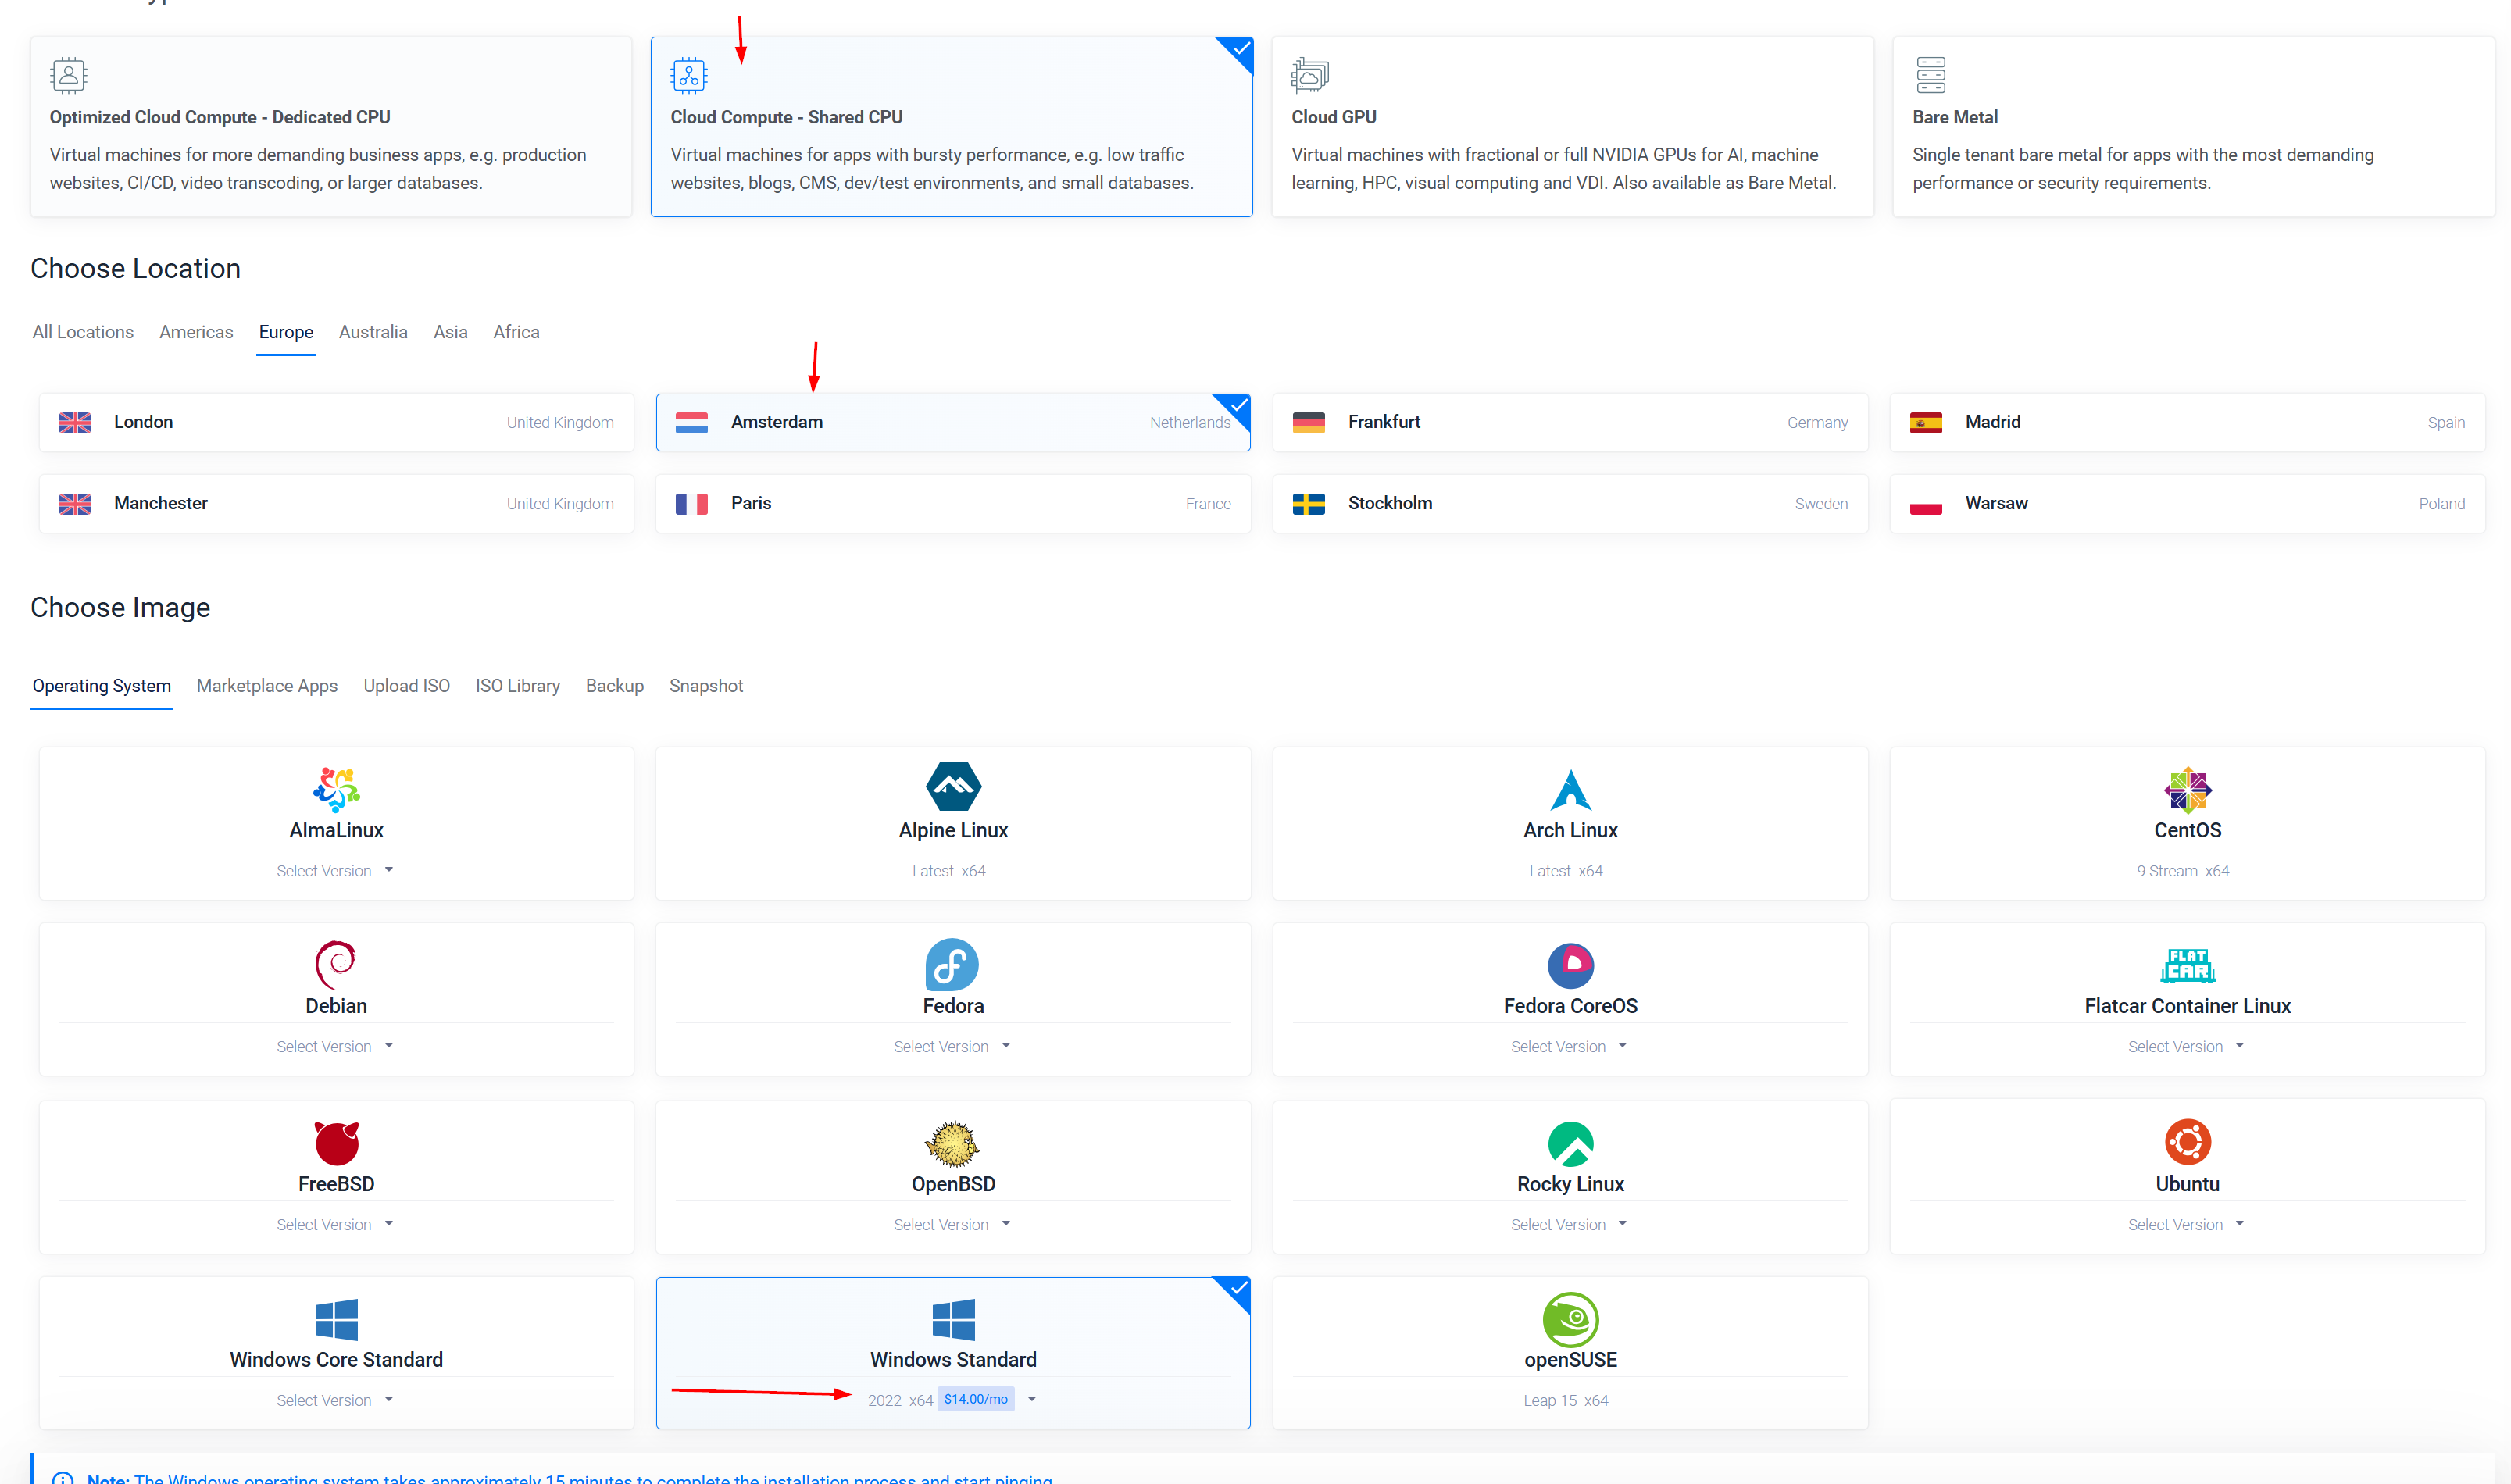 **Server Location: Choose a location that’s nearest to you or where you want your server to be. In this example, Toronto is selected.
Server Image: Select Windows Standard and then choose the latest version, which is Windows Server 2022. 🪟
 Server Size: Choose the $24/month option, which includes 1 vCPU and 2 GB of memory. This should be sufficient for our purposes. 💸
🛑 Virtual Private Cloud: Do not select a VPC for the Windows Server. 🛑 Firewall Group: Leave it blank. This will allow everyone to access the server, which is necessary for the exercise. 🌐 Server Hostname: Give it any username of your choice. 👌
♾️**Step 4: Deploy Your Server ** After configuring the settings, click on Deploy. It will take a few minutes for the server to be ready. You can monitor the progress in the dashboard.
🖥️ Accessing Your Windows Server
Step 1: View Console and Login 🔑
Login: Click on the arrow button, select Show Extra Keys, and then click on Send Control Alt Delete. ⌨️ Password: Copy the server password from the Vultr dashboard and paste it in using the clipboard function. Then click on Sign In. 🔐
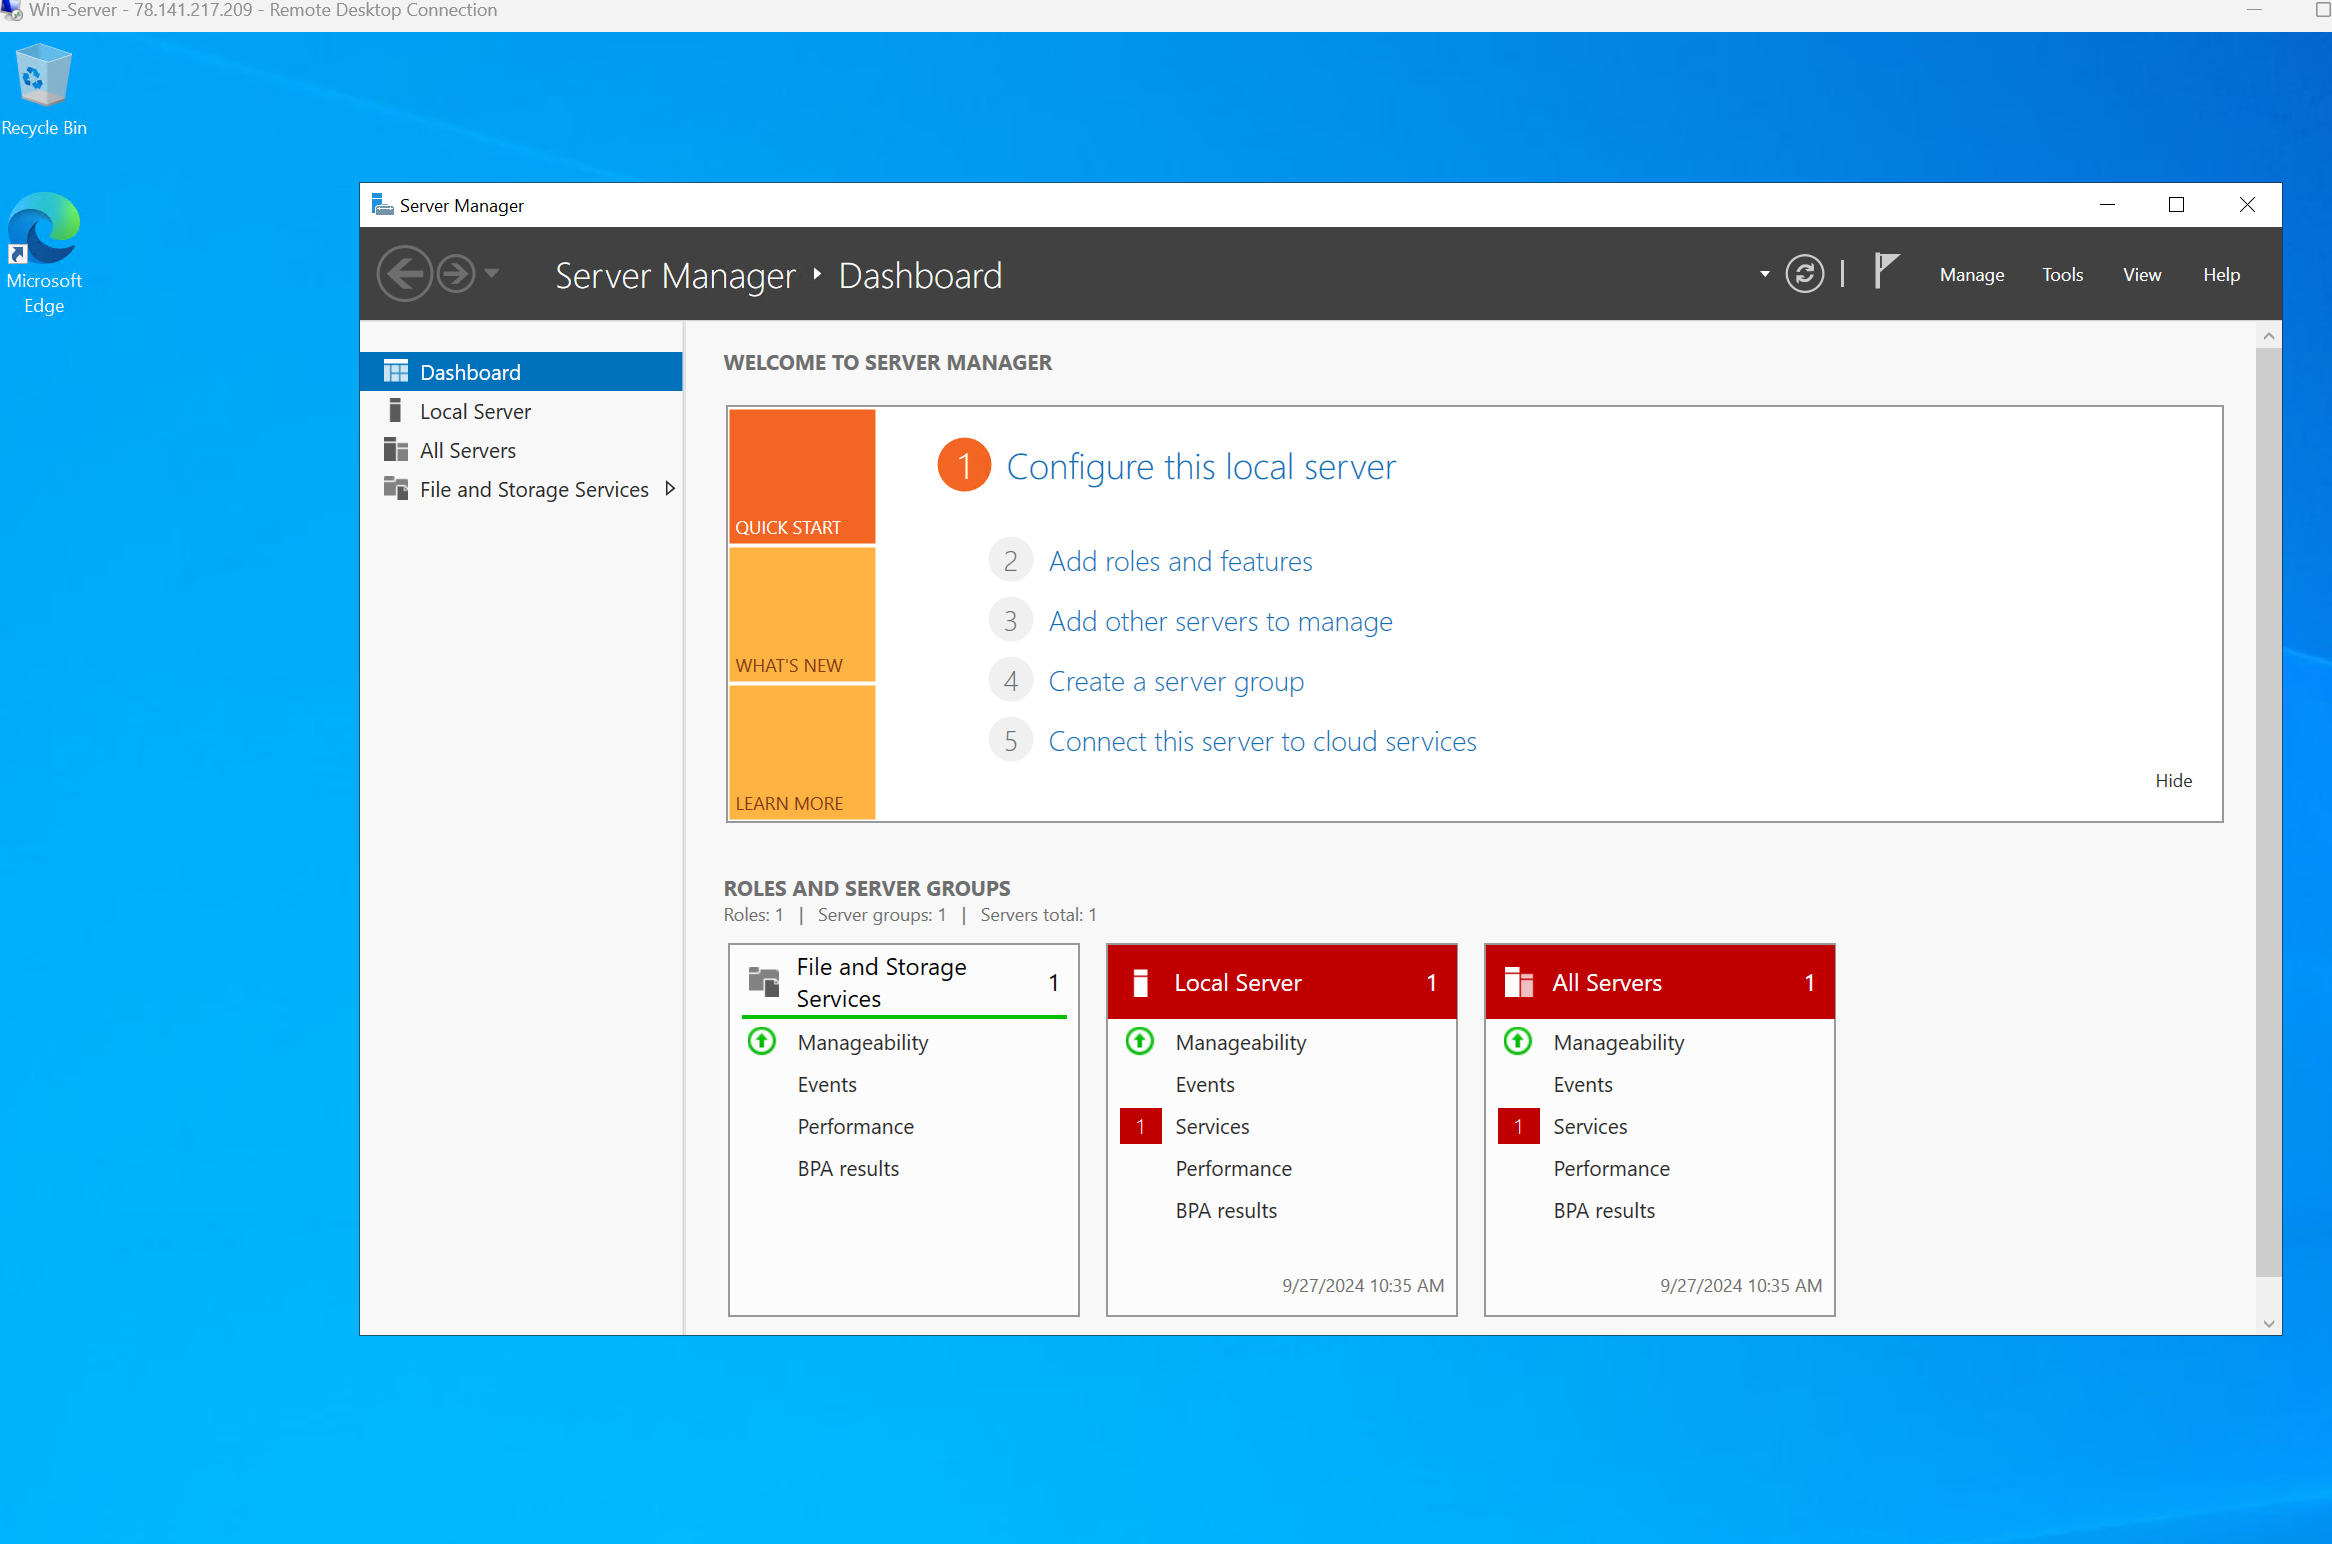
To verify that RDP is exposed to the internet:
Copy the public IP address of your server. 📋 Open Remote Desktop on your local machine. 🖥️ Paste the IP address and click Connect. 🔌 You should be able to connect to your server confirming that RDP is exposed.
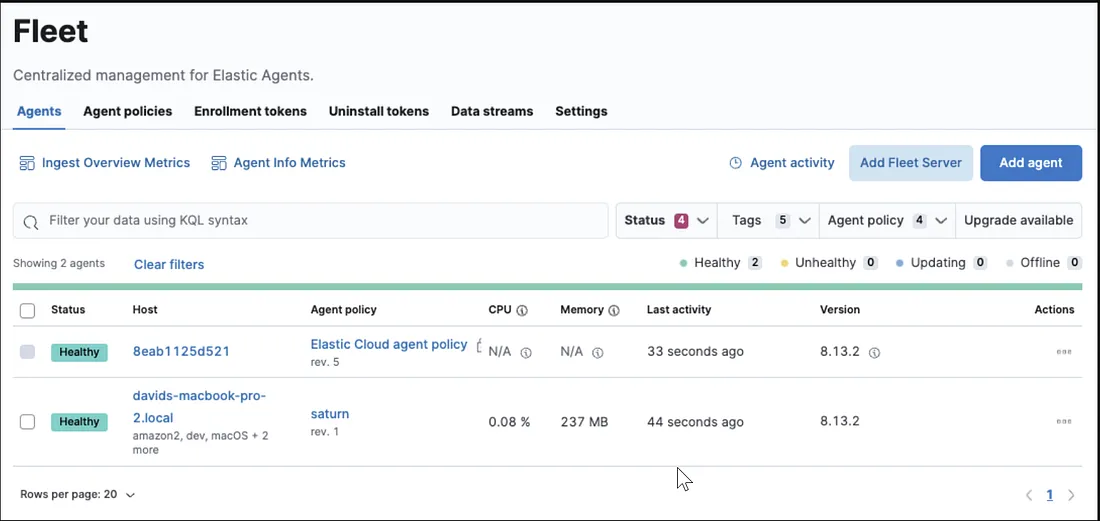
Introducing Fleet Server: A Fleet Server is the component that connects your Elastic Agents to a fleet, enabling centralized management of all your agents. With Fleet, you can easily update agent policies, add new integrations for data ingestion, or change where the agents forward their data (Elasticsearch or Logstash).
🛠️ Setting Up the Fleet Server Step 1: Deploy a New Server
We’ll start by creating a new server that will function as our Fleet Server. Here’s how you can do it:
Click on Deploy at the top-right corner. 2. Select Deploy New Server.
- Choose Ubuntu 22.04 with the following specs:
1 CPU 4 GB RAM No auto backups No IPv6
Ensure the network is set to Virtual Private Cloud 2.0 with the correct IP address.
Ensure the network is set to Virtual Private Cloud 2.0 with the correct IP address.
While the server is being created, let’s move on to setting up the Fleet Server in the Elastic web GUI.
Step 2: Configuring the Fleet Server
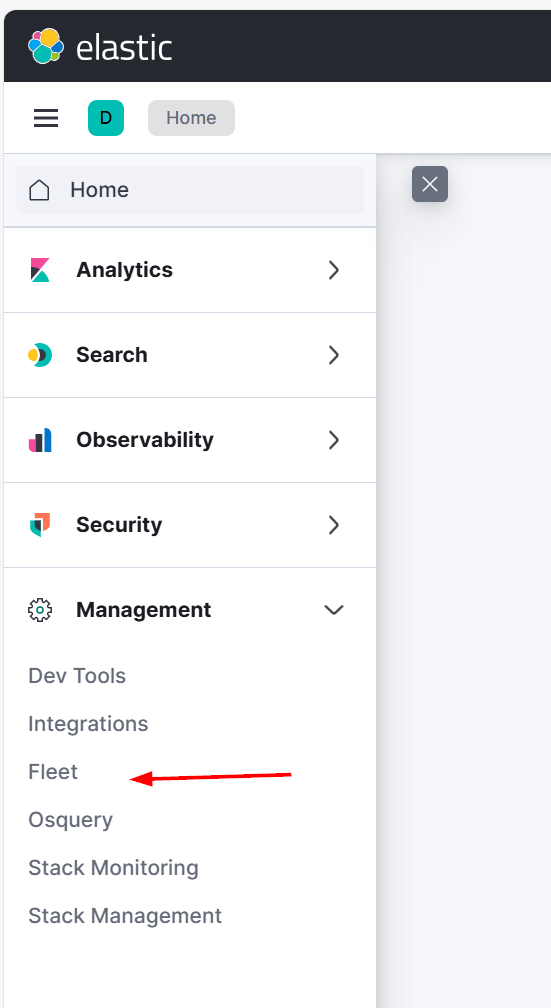
Go to the Elastic web GUI using your public IP address on port 5601. Navigate to the Fleet section under Management from the hamburger menu on the left.
3. Click Add Fleet Server and choose the Quick Start option.
4. Enter the name of your choice.
5. Copy your Fleet Server public IP address from Vultr dashboard and paste it in the URL field, ensuring it starts with https://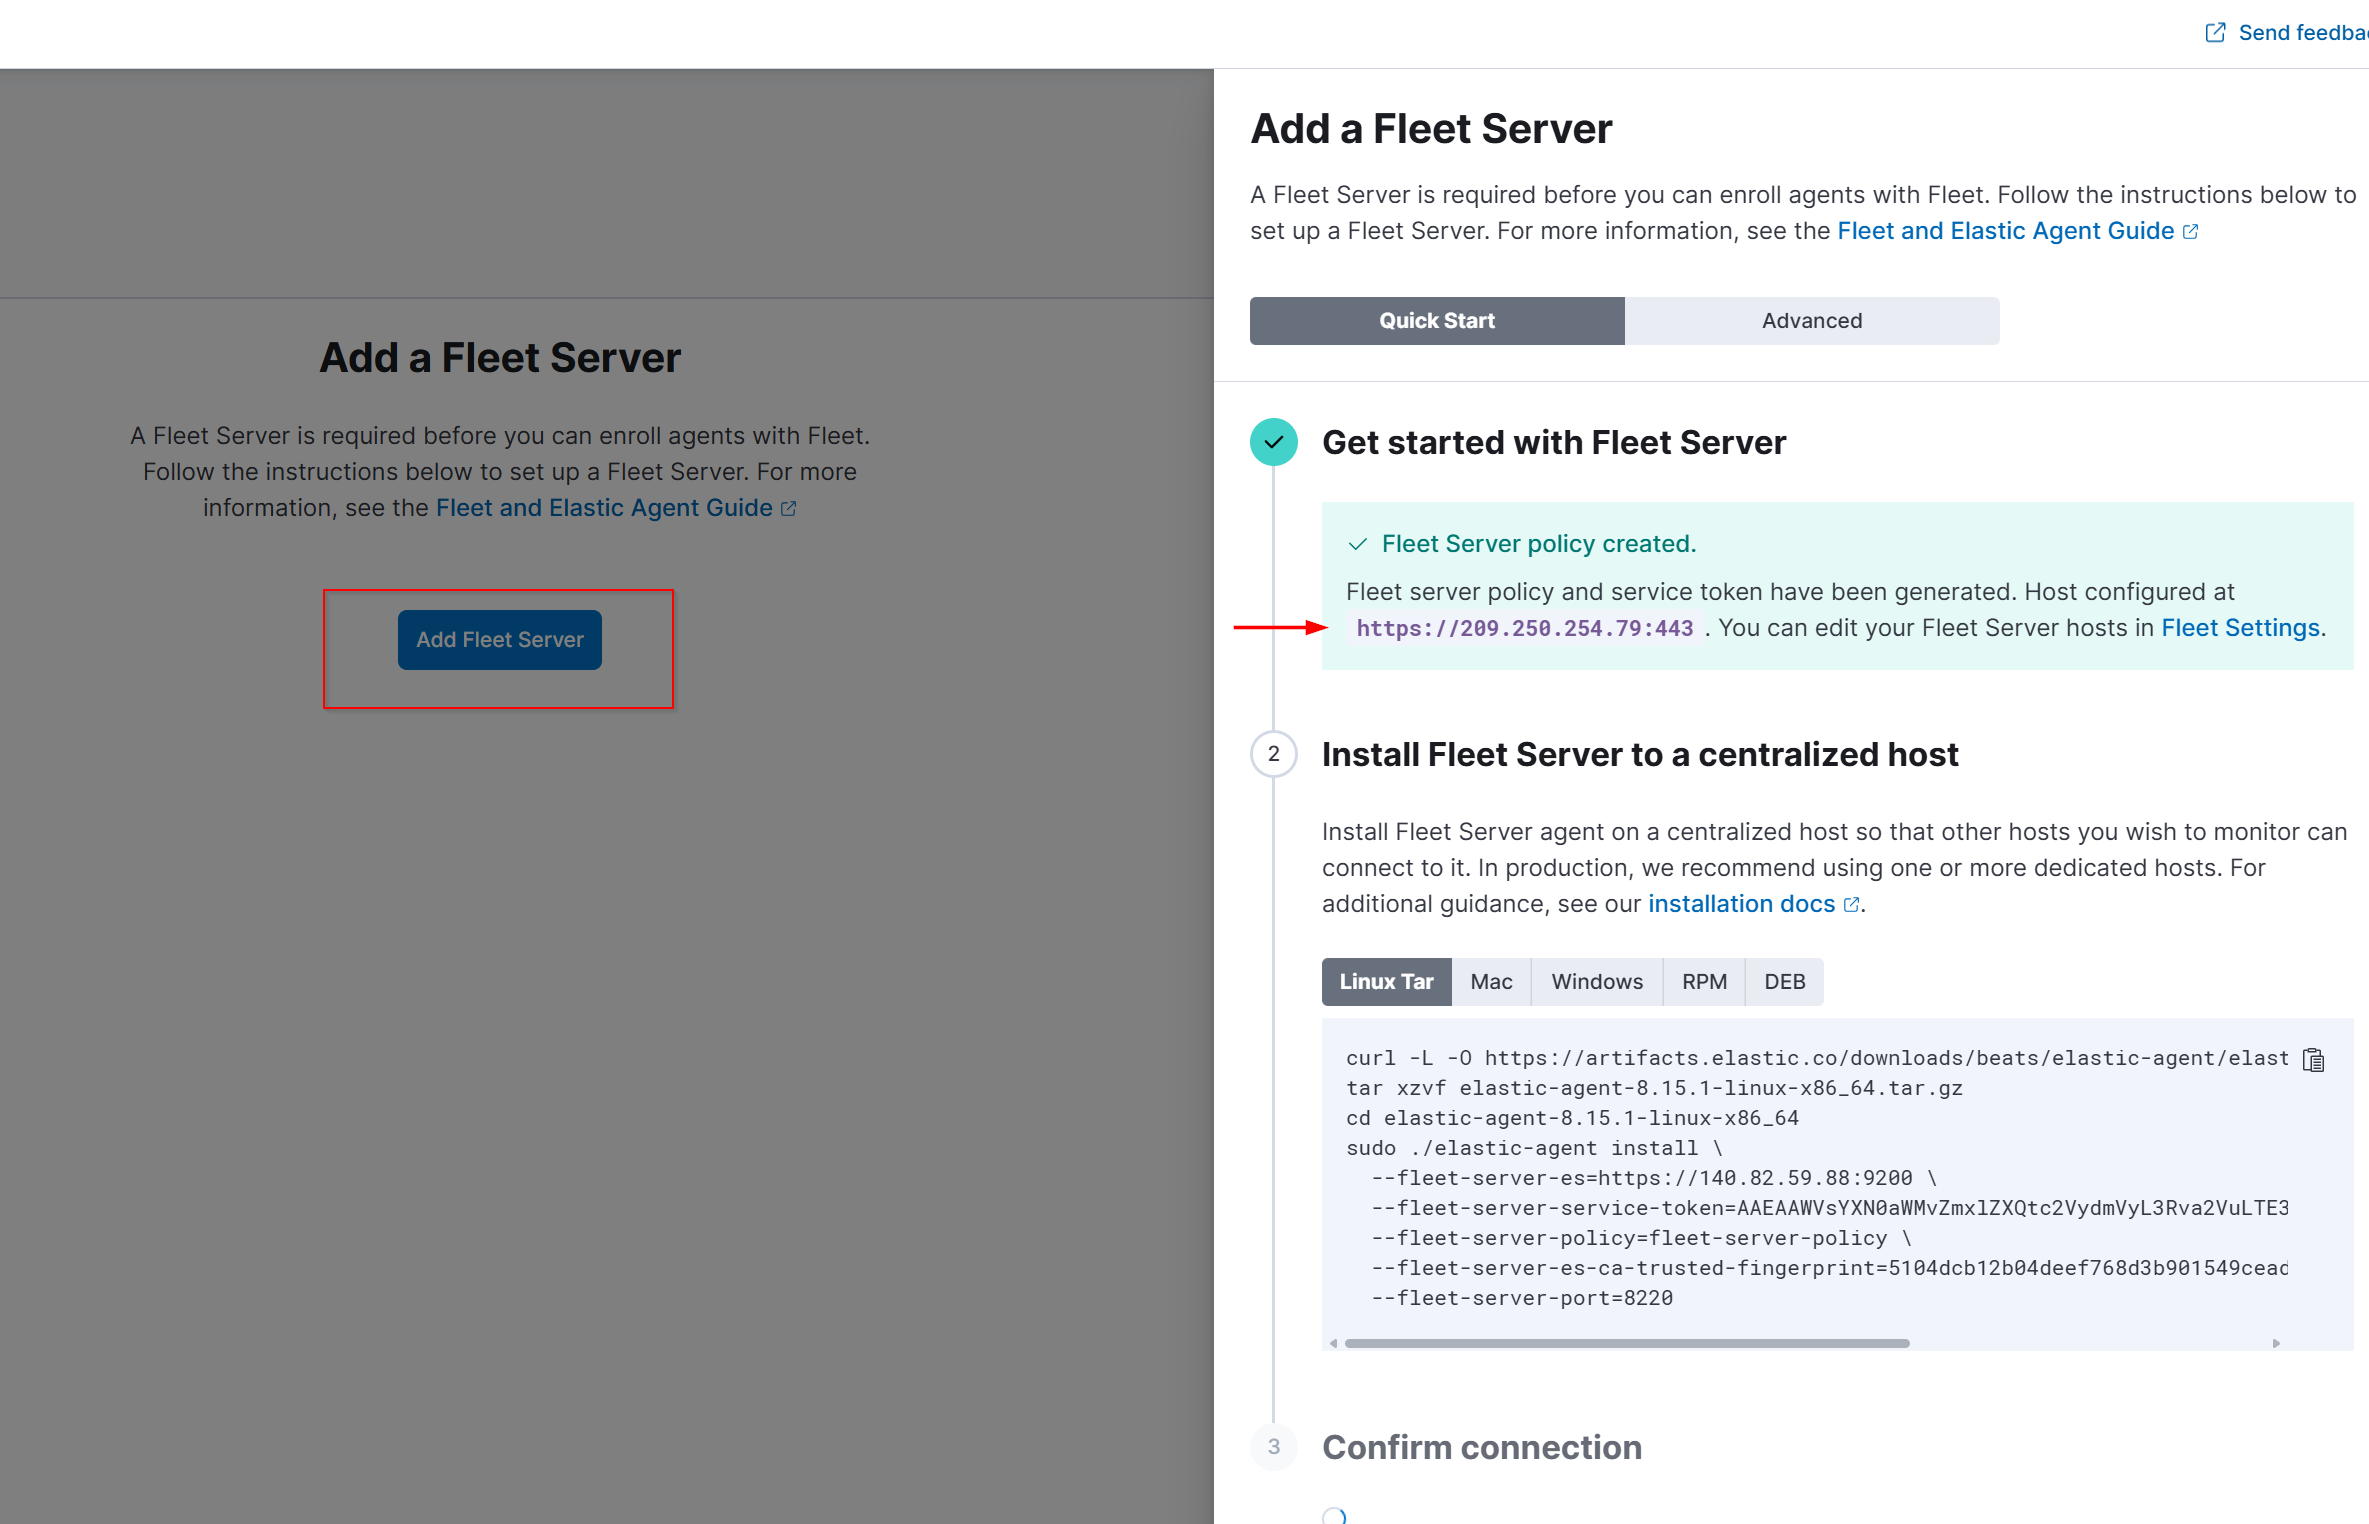
6. Click Generate Fleet Server Policy.
Once the policy is generated, you’ll see a command that needs to be run on your Fleet Server.
🔧 Setting Up the Elastic Agent on Fleet Server Step 3: SSH into the Fleet Server
Copy the IP address of your Fleet Server. Open a new CMD instance and type:
ssh root@<your-fleet-server-ip>
- Enter the password when prompted.
Step 4: Update and Install Elastic Agent
Copy the command from the Elastic web GUI and paste it into your Fleet Server terminal.
Confirm that you want to install the Elastic Agent by typing Y.
🔍 Troubleshooting and Firewall Configurations Step 5: Troubleshooting Enrollment Issues If the enrollment fails, you might need to adjust your firewall settings:
Allow Port 9200 on the ELK server:
sudo ufw allow 9200
Check and Adjust Fleet Server Firewall:
sudo ufw allow 8220 sudo ufw allow 443
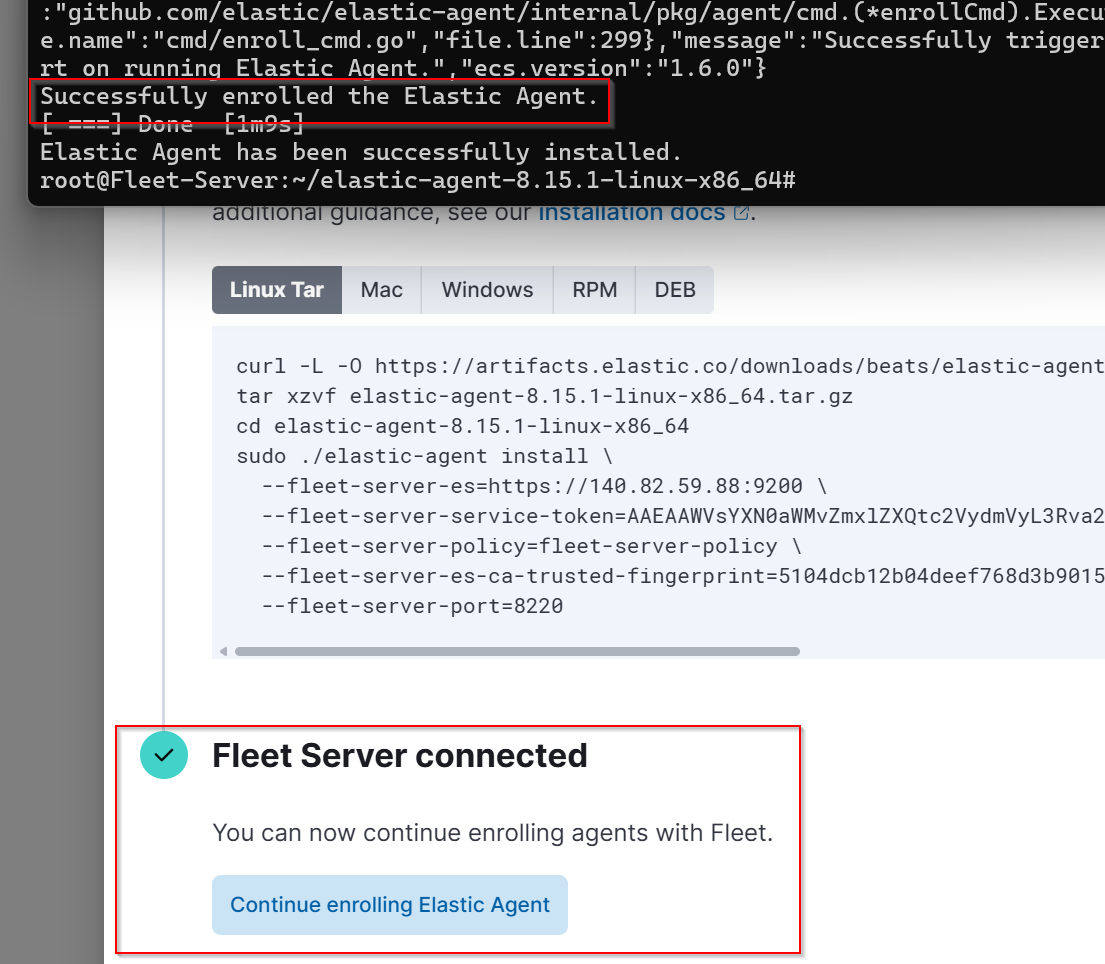
🚀 Successful Enrollment and Monitoring Step 6: Validate the Enrollment
After troubleshooting, you should see a confirmation in the Elastic GUI that your Fleet Server is connected. Now you can proceed to install the Elastic Agent on your Windows Server.
Step 7: Installing Elastic Agent on Windows
Go to the Fleet section and click Add Agent
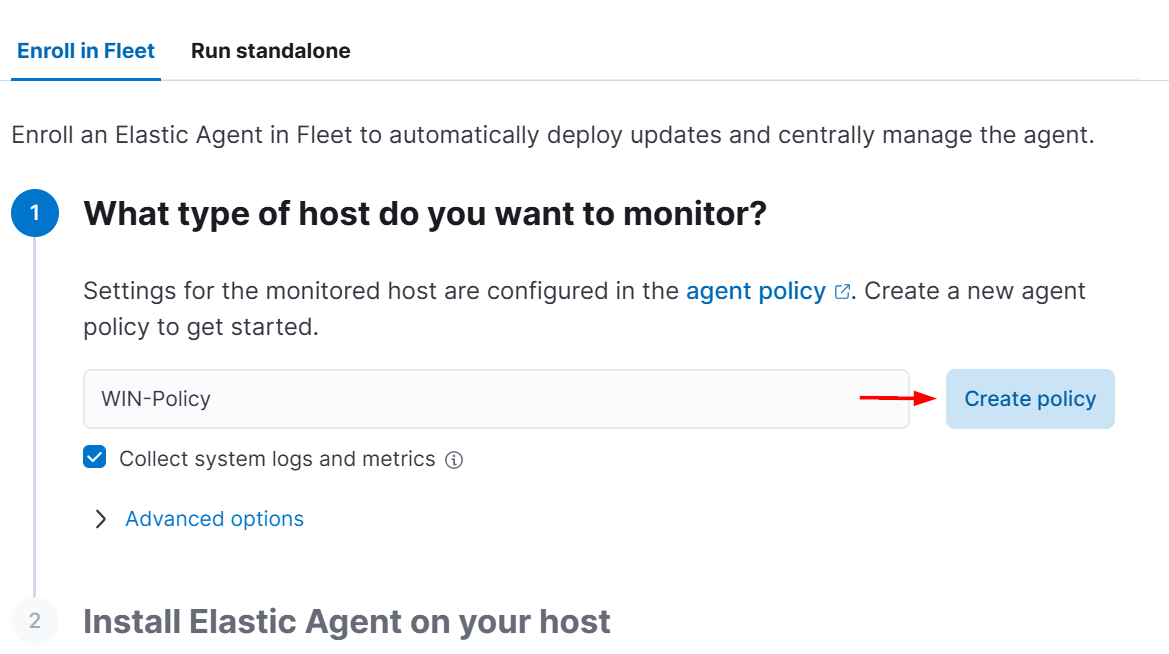
Select Windows as the host type and copy the command provided.
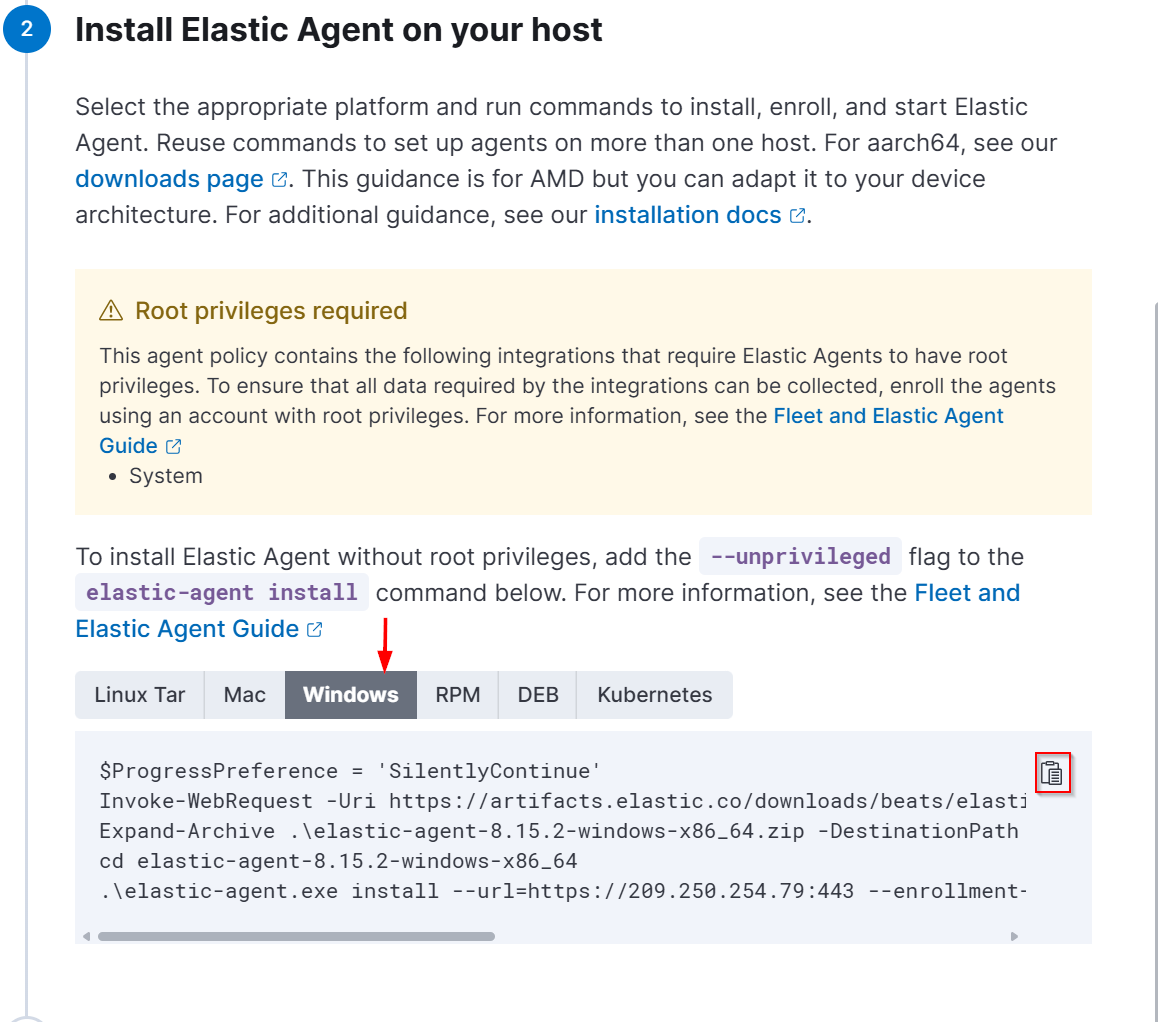
Paste it in a notepad file and make few changes in it to successfully enrol the agent.
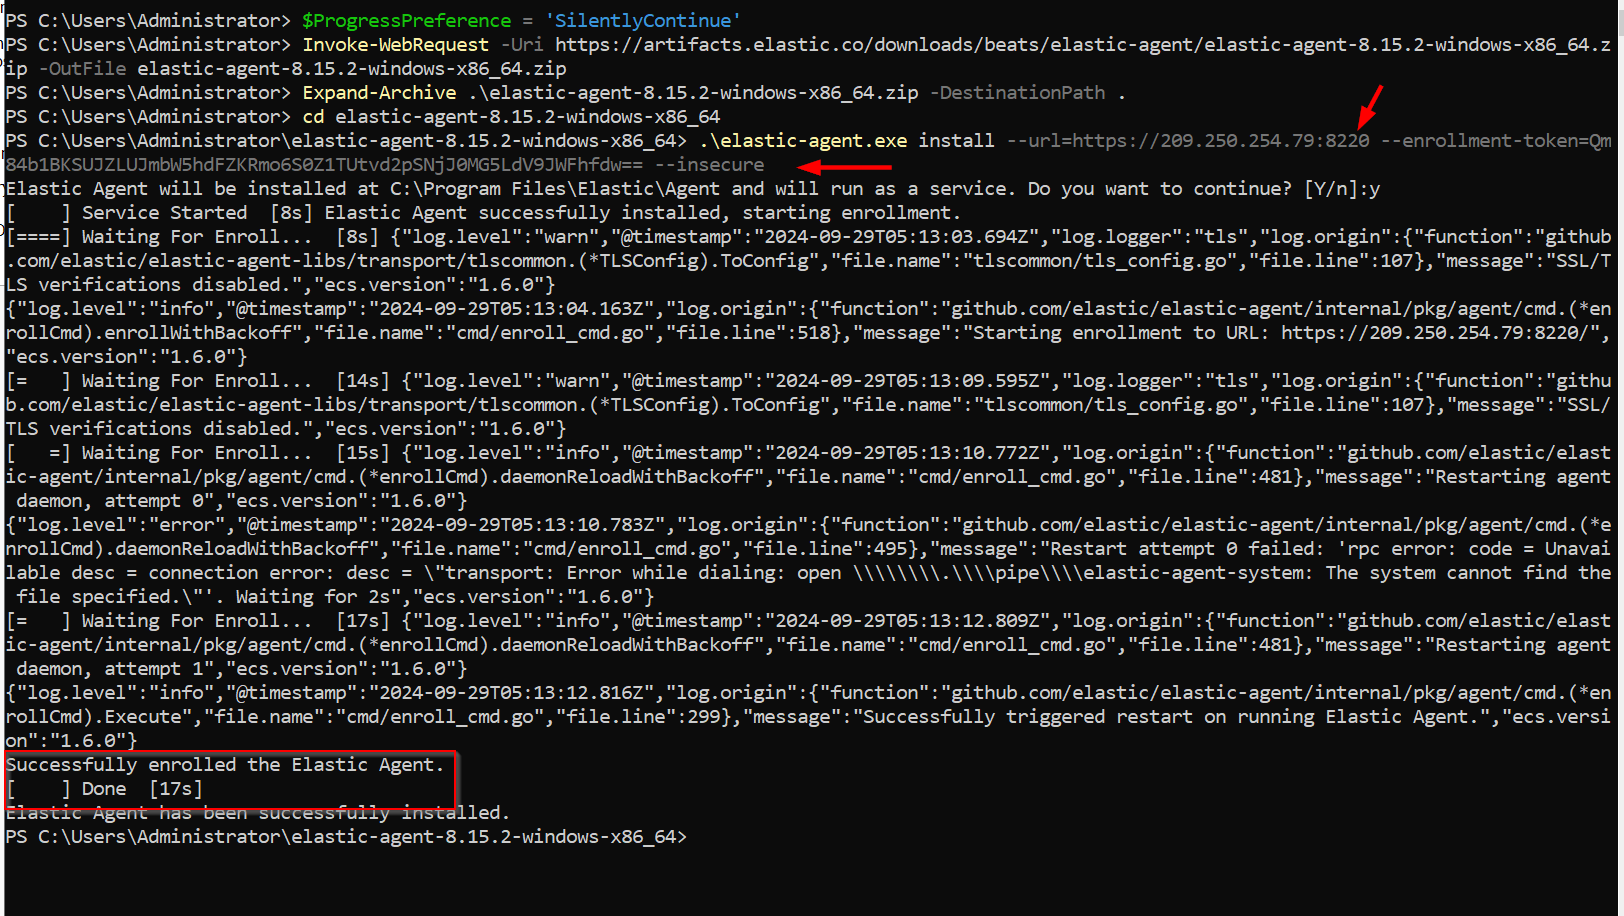
Note: You need to make few changes in the URL to make it work:
url=https://
And add insecure at end of the line as we don't have a SSL certificate configured. Please refer below screenshot.
- Also go back to your Elastic Web GUI and go to Fleet section under Management.
Click on Settings and make below change in the host URL.
We need to change the port from 443 to 8220 so that it reflects what we did in the command.
Click on save and apply settings.

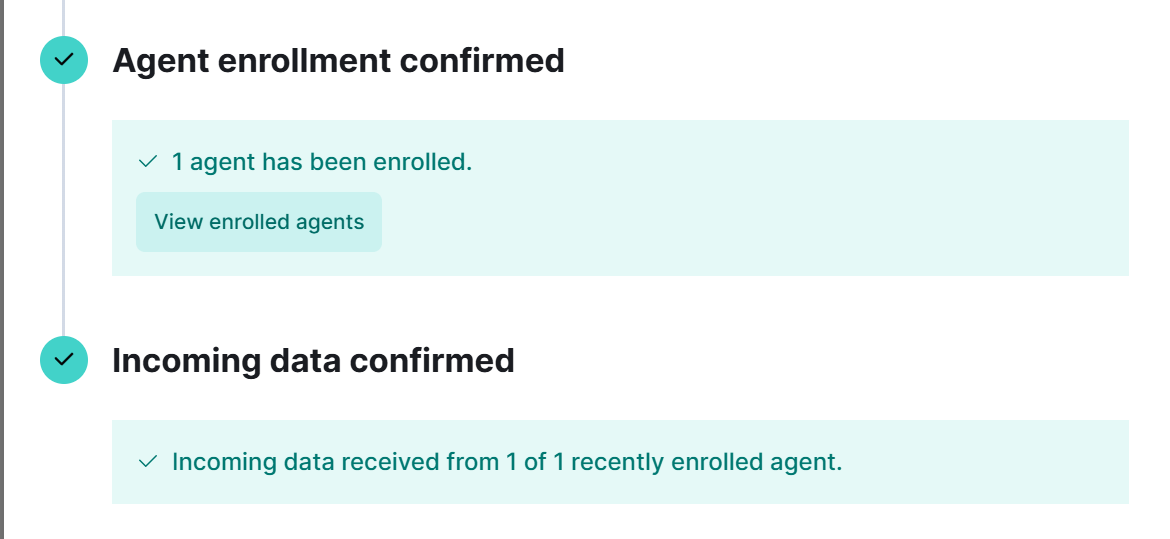
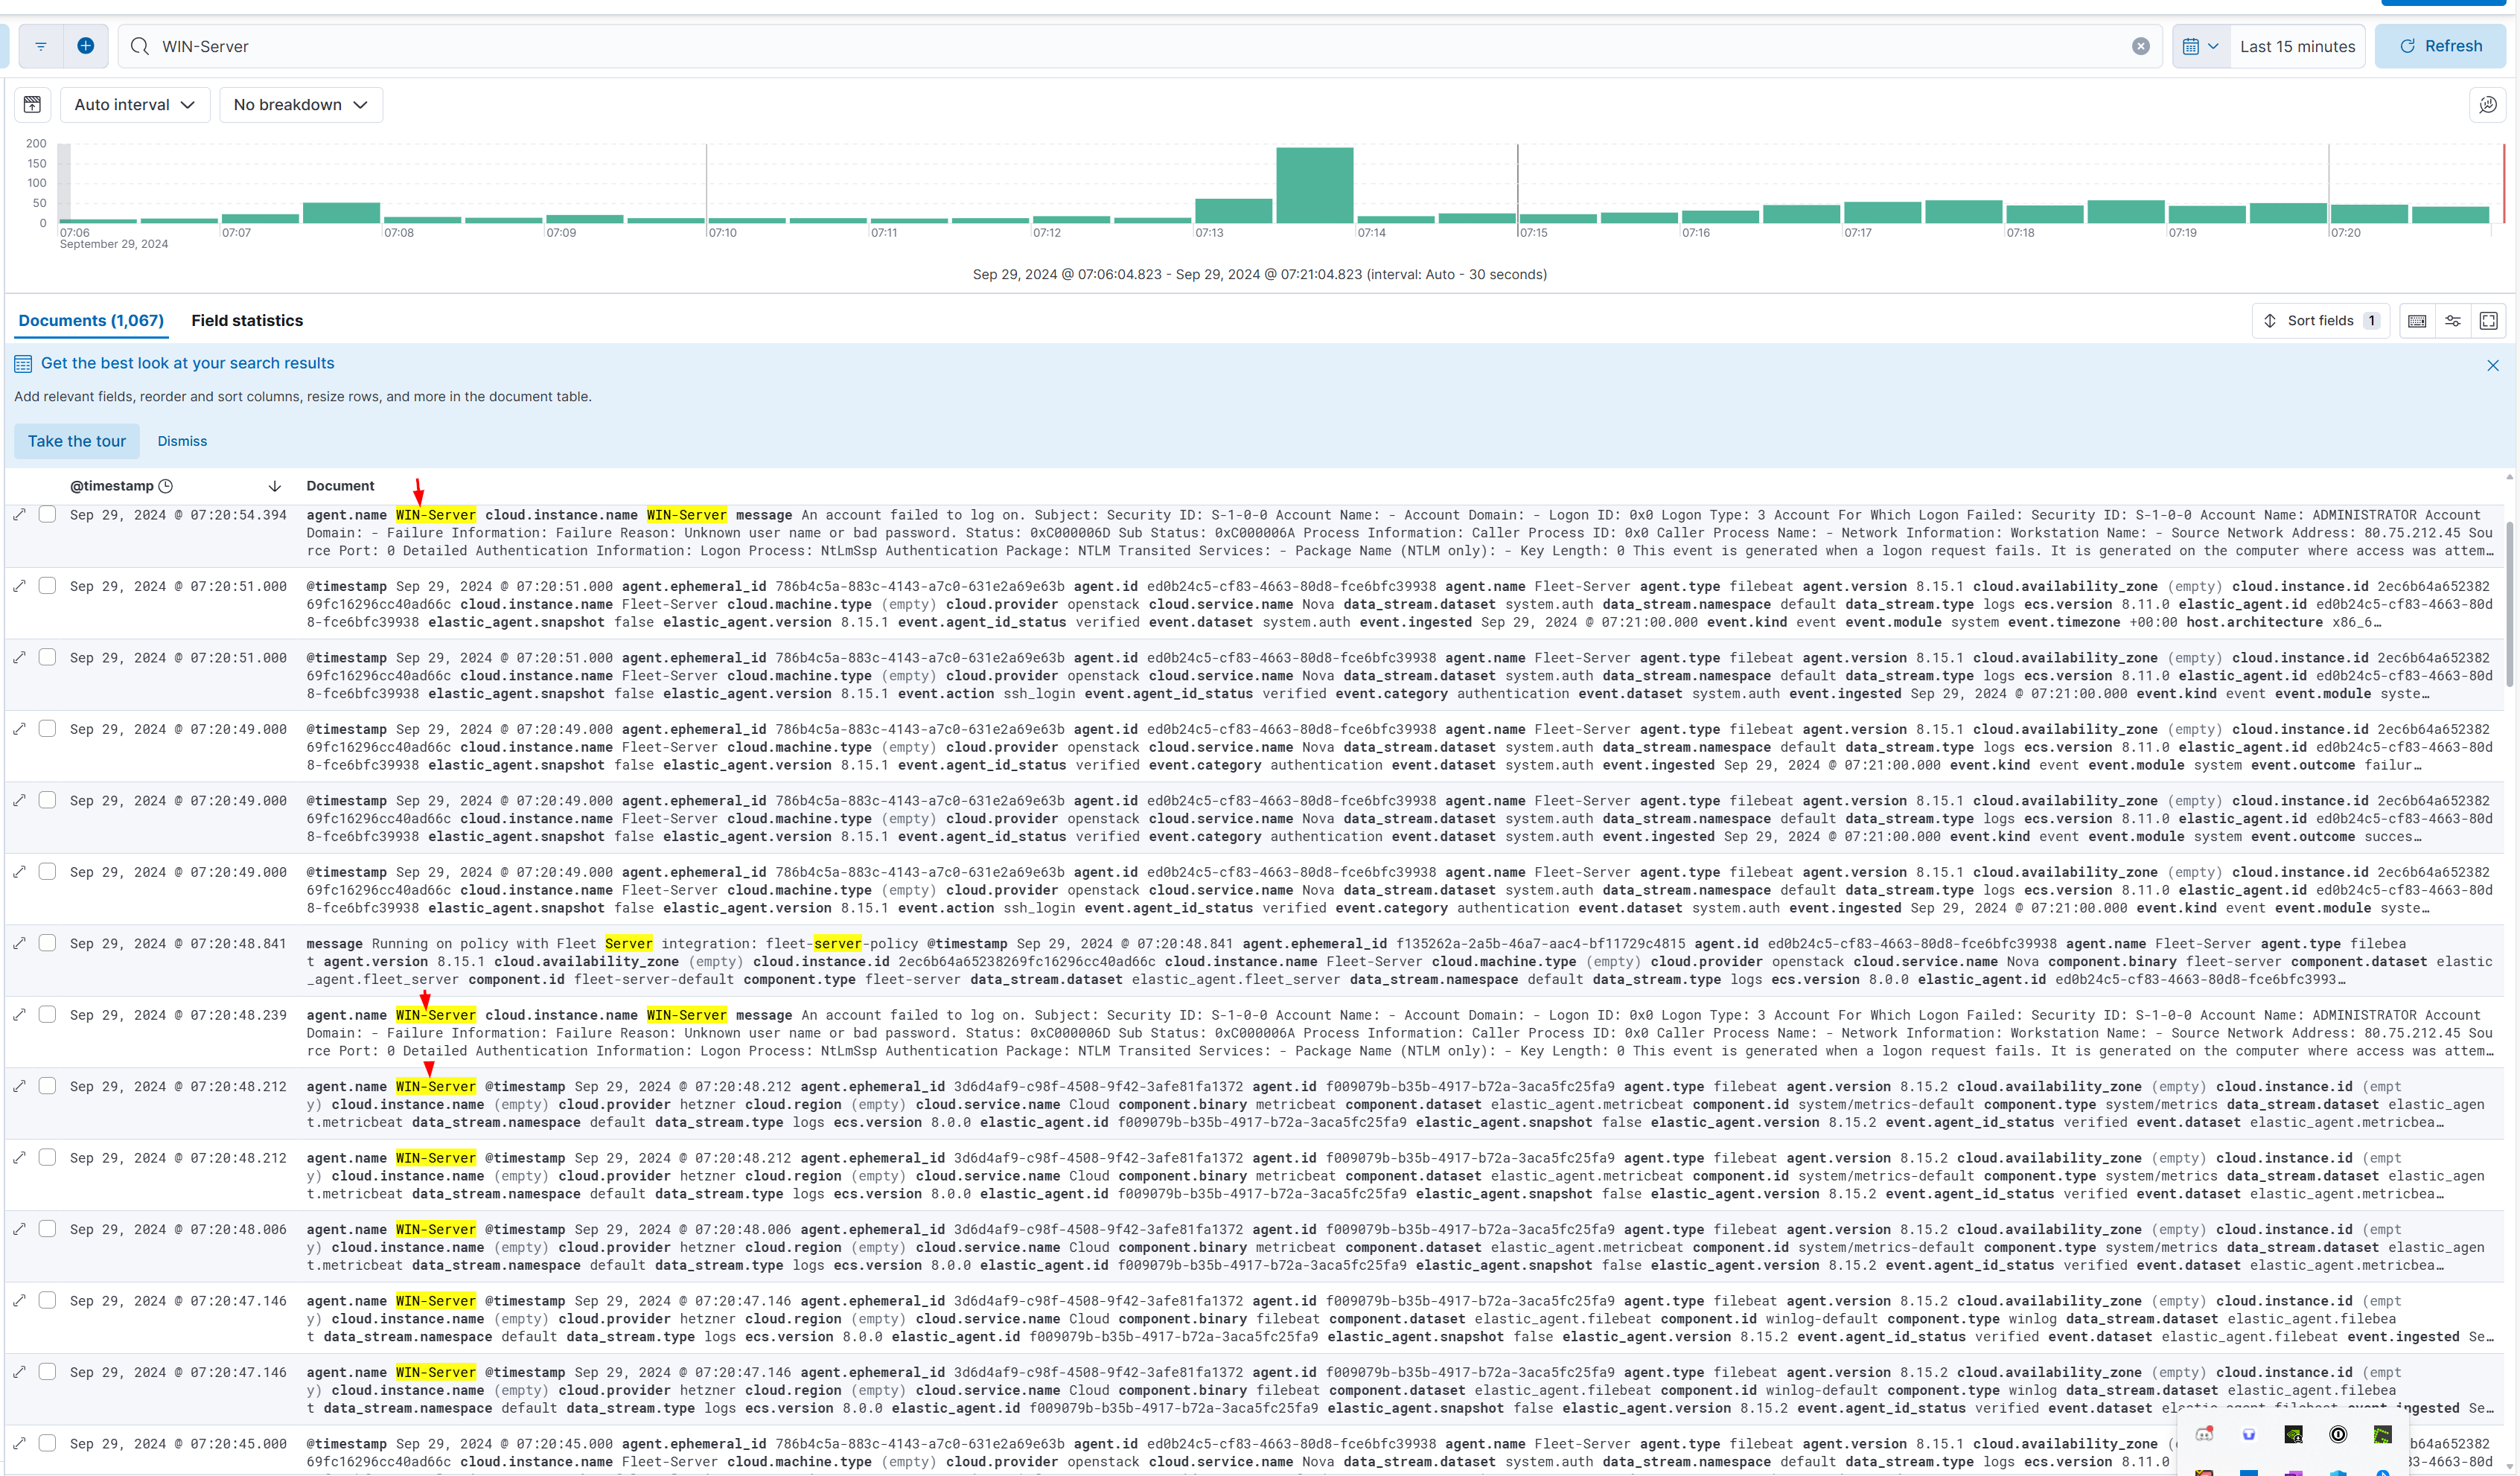
𐙚 Wrapping Up After completing these steps, your Windows server should be successfully enrolled in the Fleet, and you should start seeing logs in the Elastic GUI. You can now monitor your Windows Server activity, including critical events like failed logins
🎉 **Conclusion-Week 1️ **
- Designed the logical architecture of the SOC environment, showing key components and their interactions
- Set up Elastic & Kibana for log collection and visualization
- Configured Fleet Server to manage endpoints and forward logs to Elastic
- Deployed Windows and Ubuntu servers for endpoint monitoring
- Installed and configured Elasticsearch and Kibana
- Prepared the environment for attack simulations and real-time monitoring
This sets the stage for attack detection, telemetry collection, and incident response.
